
 Stock Plunges Below Key Support as Analysts Eye $53 Target")
Key Takeaways
- SOL currently hovers near $69.53, posting a 6% decline over 24 hours and shedding over 42% year-to-date.
- The crucial $77 floor has been breached, prompting analyst Ali Martinez to identify $53 as the subsequent major support zone.
- All key exponential moving averages (20, 50, 100, and 200-day EMAs) now sit above current price, signaling widespread bearish momentum.
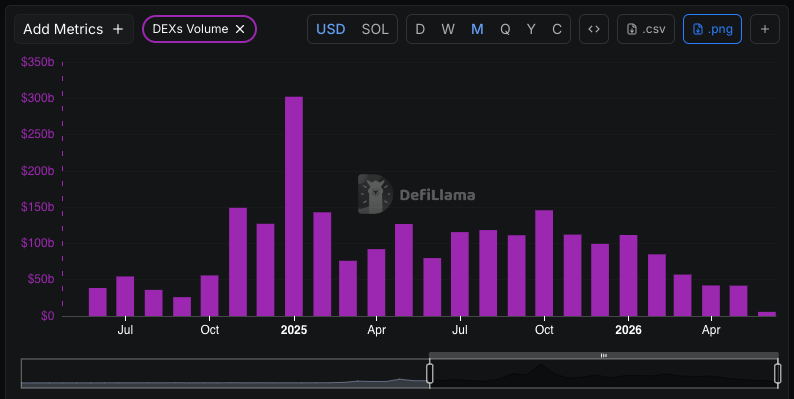
- Solana network DEX activity has plummeted 62% from January peaks, dropping from $111 billion to $42 billion in monthly volume.
- After five months of consolidation between $77 and $97, the breakdown suggests further downside potentially reaching $50.
Solana has accelerated its descent following a critical breach of support that had held for months. Current trading data shows SOL at $69.53, accompanied by $8.31 billion in 24-hour trading volume and maintaining a $40.22 billion market capitalization.
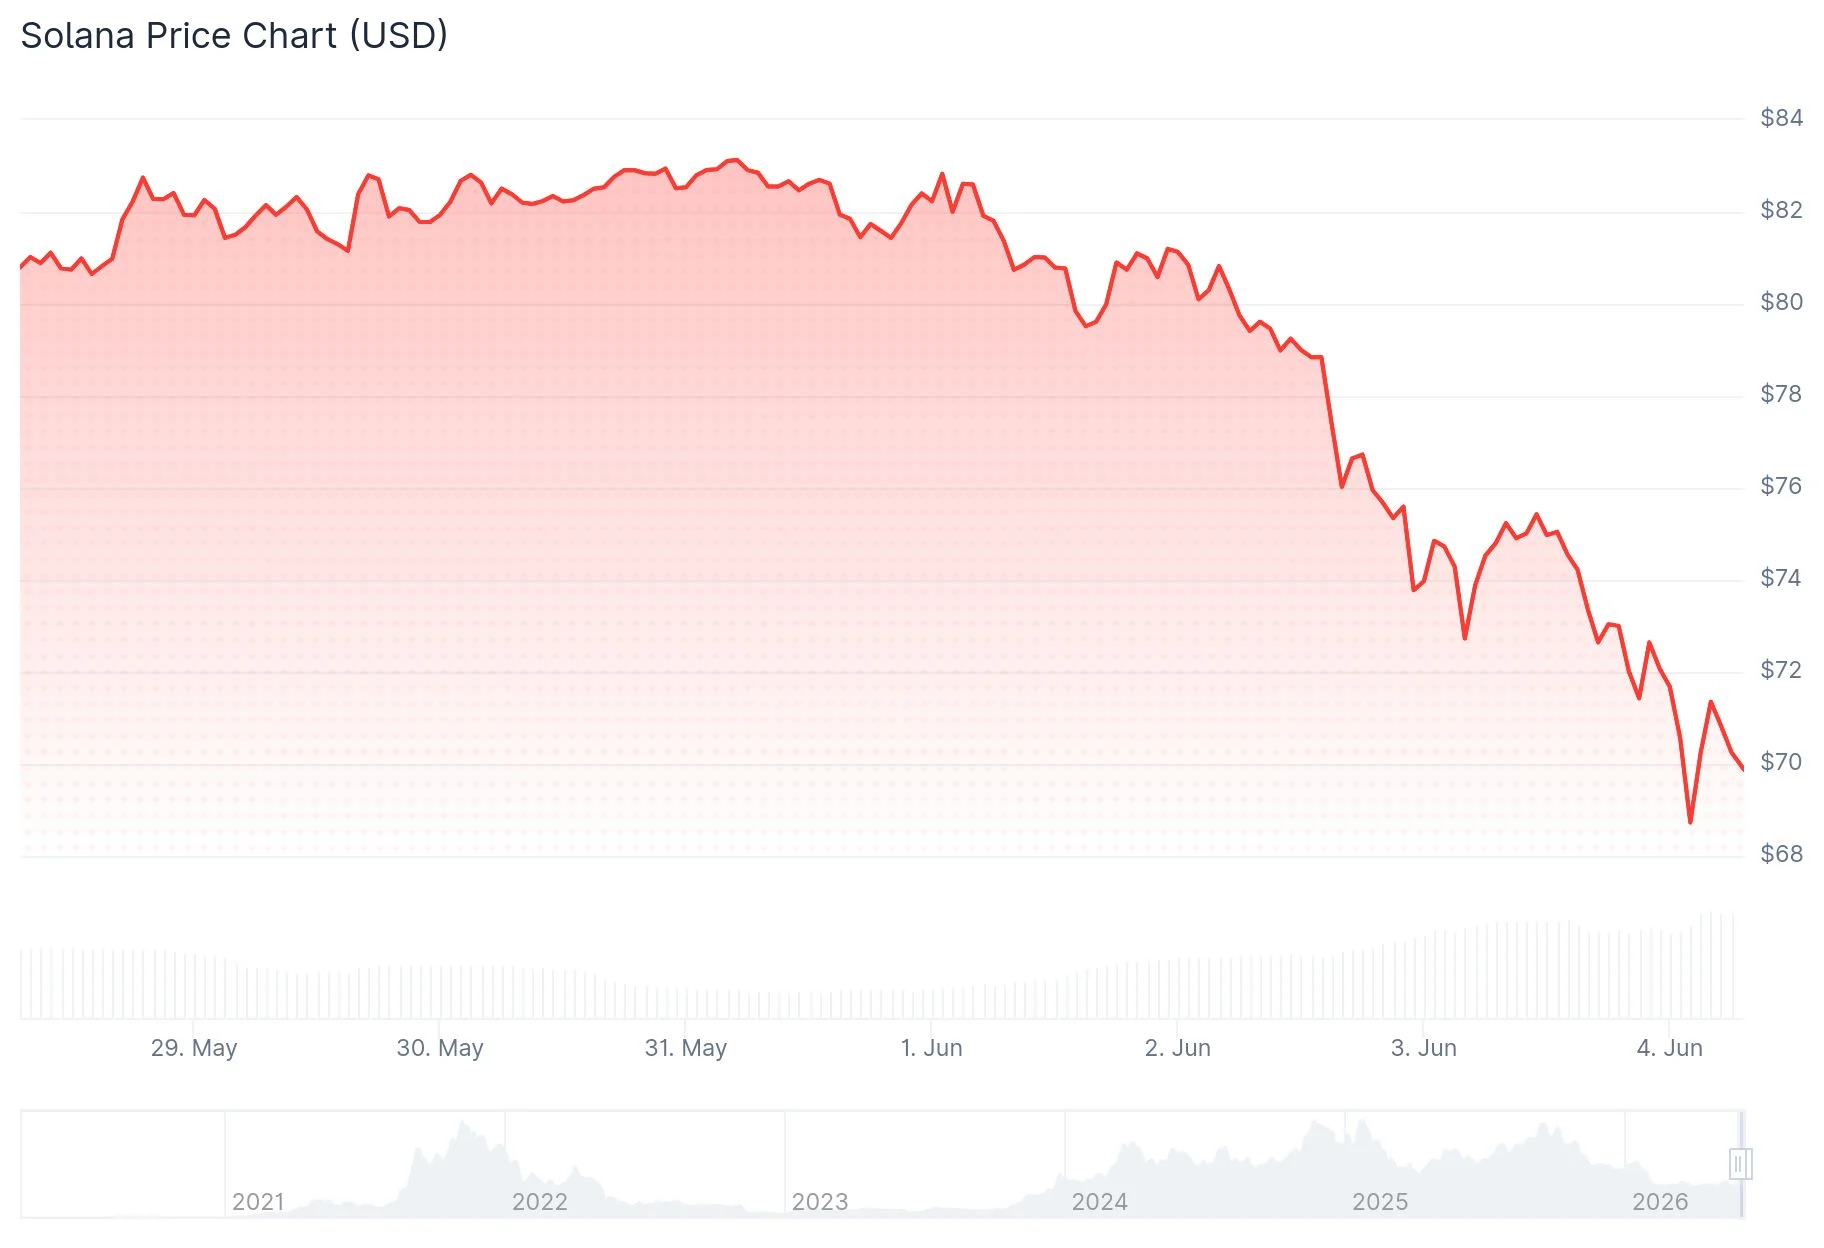
The digital asset has declined 6.45% over the past day and experienced a devastating 42% drawdown year-to-date, positioning it among the poorest performers within large-cap cryptocurrency markets throughout 2026.
Market analyst Ali Martinez highlighted the $77 threshold as crucial support territory, utilizing insights from the UTXO Realized Price Distribution (URPD) framework. This price zone represented a significant cluster of historical investor positions, indicating substantial purchasing occurred within this band.
Following this breakdown, Martinez observed minimal buying interest beneath the $77 mark. His analysis pinpointed $53, $35, and $24 as subsequent zones where meaningful support could materialize.

When major support thresholds collapse, volatility typically intensifies as buyer participation diminishes and sellers encounter less resistance.
Bearish Technical Setup Dominates Charts
SOL now trades beneath every significant moving average benchmark. TradingView analysis reveals the 20-day EMA positioned at $81.19, followed by the 50-day at $84.44, the 100-day at $89.84, and the 200-day at $105.62.
This uniform positioning across multiple timeframes validates a sustained bearish trajectory. The MACD oscillator reinforces this outlook, displaying the MACD line positioned beneath its signal counterpart while expanding negative histogram bars demonstrate accelerating downward pressure.
Trader and analyst Daan Crypto Trades weighed in on the wider altcoin landscape, observing that numerous tokens exhibit chart patterns resembling SOL’s current structure. He referenced multi-month consolidation ranges experiencing breakdowns or wicks penetrating range lows. Daan suggested attractive trading opportunities would emerge once prices reclaim these local boundaries, potentially enabling moves toward range highs or beyond.
The weekly Relative Strength Index (RSI) currently registers at 32, a reading generally interpreted as bearish when declining beneath the 40 threshold.
Network Metrics Show Significant Deterioration
Decentralized exchange volumes across the Solana ecosystem have contracted 62% since the beginning of the year. Peak monthly DEX volumes reached $111 billion on the network. Recent data shows this metric collapsed to $42 billion.
Broader network transaction volumes have also stagnated around 700 million weekly transactions following a February peak of 959 million.
Market observers attribute this decline primarily to waning enthusiasm for meme coin speculation. SOL’s blockchain infrastructure generated substantial recent activity from meme token trading, and as this sector cooled, corresponding network statistics followed suit.
Solana penetrated its five-month trading range bounded by $77 and $97 on daily timeframes. Technical analysts typically interpret such breakdowns as continuation signals for existing downtrends.
The immediate technical objective centers on $65. Successfully defending this level might provide temporary stabilization, though failure to hold could accelerate movement toward Martinez’s $53 projection.