

Key Takeaways
- XRP is currently consolidating near the critical $1.40 support zone, with increasing bearish signals appearing on the 4-hour timeframe
- Technical charts reveal a descending triangle formation alongside MACD bearish crossover
- The Relative Strength Index has declined to 40, indicating diminishing bullish momentum
- Institutional demand remains evident as XRP ETFs attracted between $15.74M and $25M in capital last week
- Market analyst Ali Charts suggested XRP is “ready for a big price move,” with potential cycle low established at $1.30
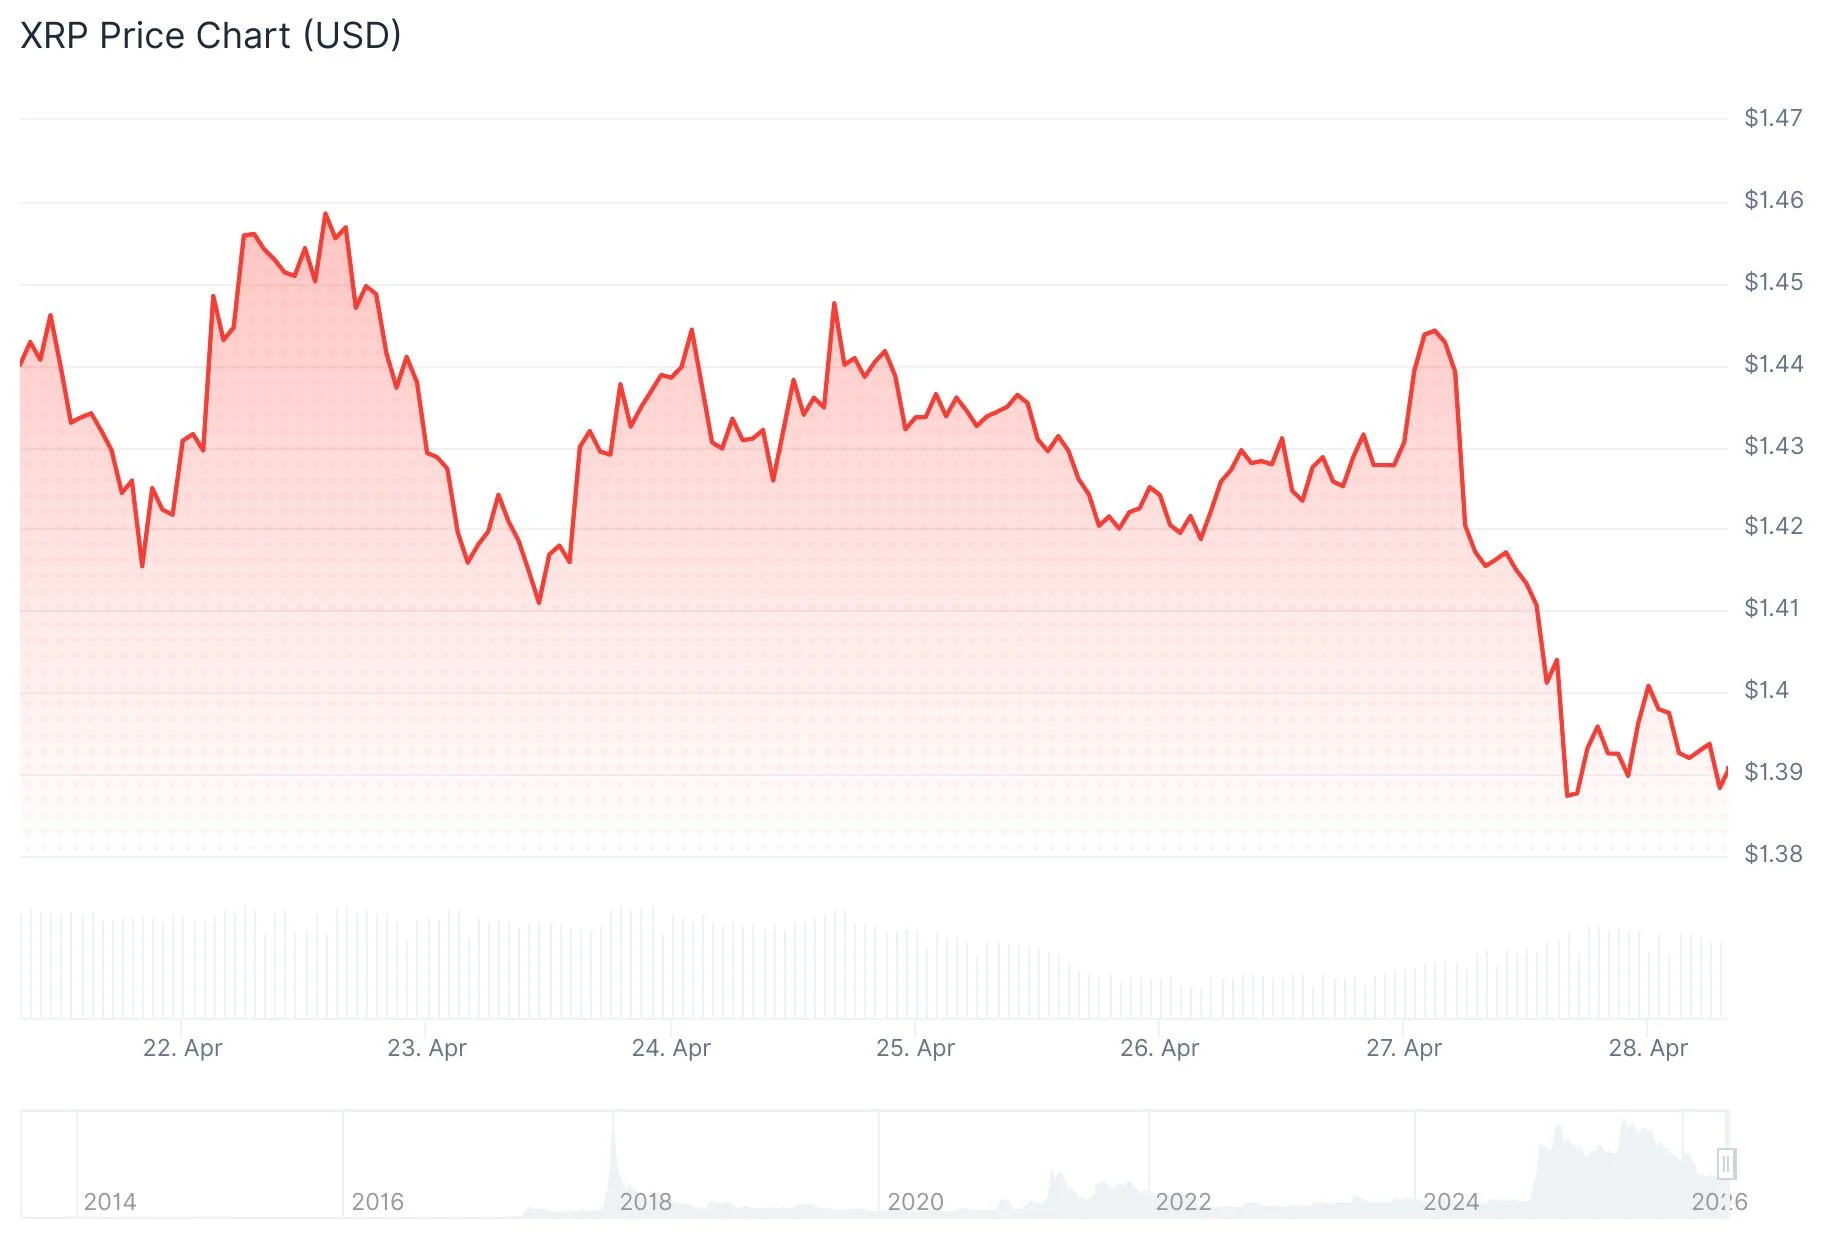
XRP continues to trade in the vicinity of $1.40 following its inability to sustain higher price levels achieved earlier this week. The digital asset faces mounting pressure as bearish forces have reasserted dominance while technical momentum indicators signal deterioration.
Chartwork on the 4-hour interval reveals the emergence of a descending triangle configuration. This technical structure consists of consecutively lower peaks pressing against a horizontal support boundary. Such formations typically suggest additional downward movement should the support zone fail.
The Moving Average Convergence Divergence indicator has executed a bearish crossover beneath its signal line. Expanding red histogram bars confirm accelerating negative momentum. Meanwhile, the RSI has retreated to approximately 40, signaling waning accumulation interest.
The $1.40 threshold has endured numerous tests throughout recent trading sessions. Repeated challenges to any support zone generally compromise its integrity over time, elevating the probability of eventual failure.

Should XRP breach $1.40 to the downside, subsequent support targets emerge at $1.38, followed by $1.36, with $1.34 representing a deeper level if liquidation accelerates.
Critical Resistance Zones for Bulls
For upward movement, buyers must first recapture $1.43. A more formidable obstacle exists at $1.45, which aligns with the upper descending trendline. Successfully breaking above $1.45 would potentially clear the pathway toward $1.50.
Over the trailing 30-day period, Bitcoin and Ethereum have appreciated 17% and 16% respectively. XRP has delivered merely 5% returns during the same window, demonstrating that capital continues flowing toward blue-chip digital assets.
Market commentator Ali Charts shared on X that “$XRP is ready for a big price move,” although the post did not specify directional bias or price objectives.
One technical strategist observed that XRP’s weekly RSI touched 30 in early March. Historical analysis shows that the three prior occasions when RSI fell beneath 33 were followed by rallies ranging from 226% to 1,460% over subsequent months.
Extrapolating from this historical precedent, strategists at FX Empire suggest the cyclical bottom may already be established at $1.30. Their outlook anticipates a near-term advance to $1.50, with $1.65 representing the next milestone.
Institutional Appetite Remains Strong for XRP ETFs
Exchange-traded products offering XRP exposure accumulated between $15.74 million and $25 million in net inflows throughout the previous week, with variance depending on data provider. Cumulative year-to-date inflows for XRP ETFs have now reached $148 million.
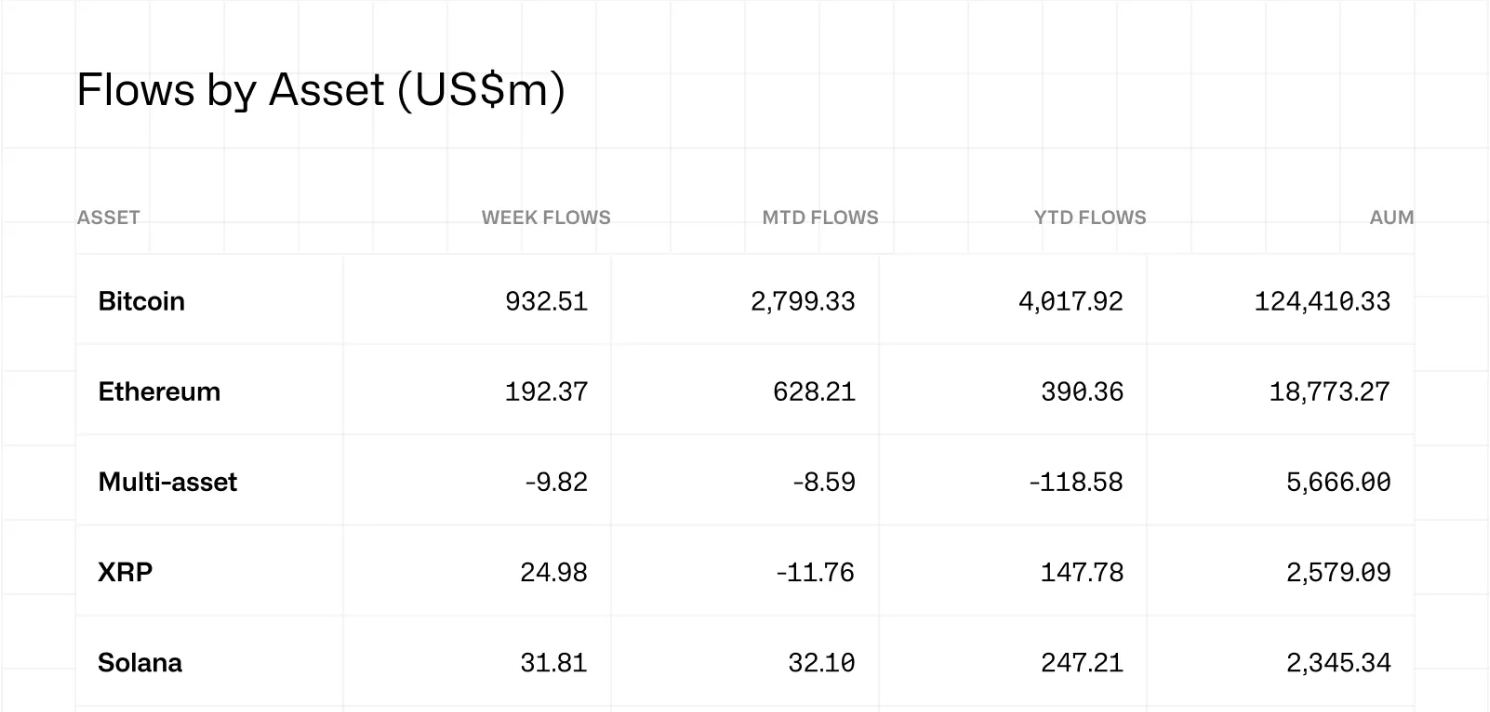
Bitcoin ETFs dominated cryptocurrency fund flows with $824 million in weekly additions, extending their positive streak to four consecutive weeks. Ethereum ETFs captured $155 million, while Solana-focused products secured $9.44 million.
The aggregate cryptocurrency ETP landscape witnessed $1.2 billion in inflows last week, per CoinShares data. The Crypto Fear and Greed Index presently registers 44, representing a decline from its recent peak of 62.
The Federal Open Market Committee meeting scheduled for April 28 commands significant market attention. Consensus expectations point to unchanged rates, with strategists forecasting no cuts throughout the remainder of the calendar year.