
 Stock: Critical Week Ahead as Price Tests Key Levels")
Key Highlights
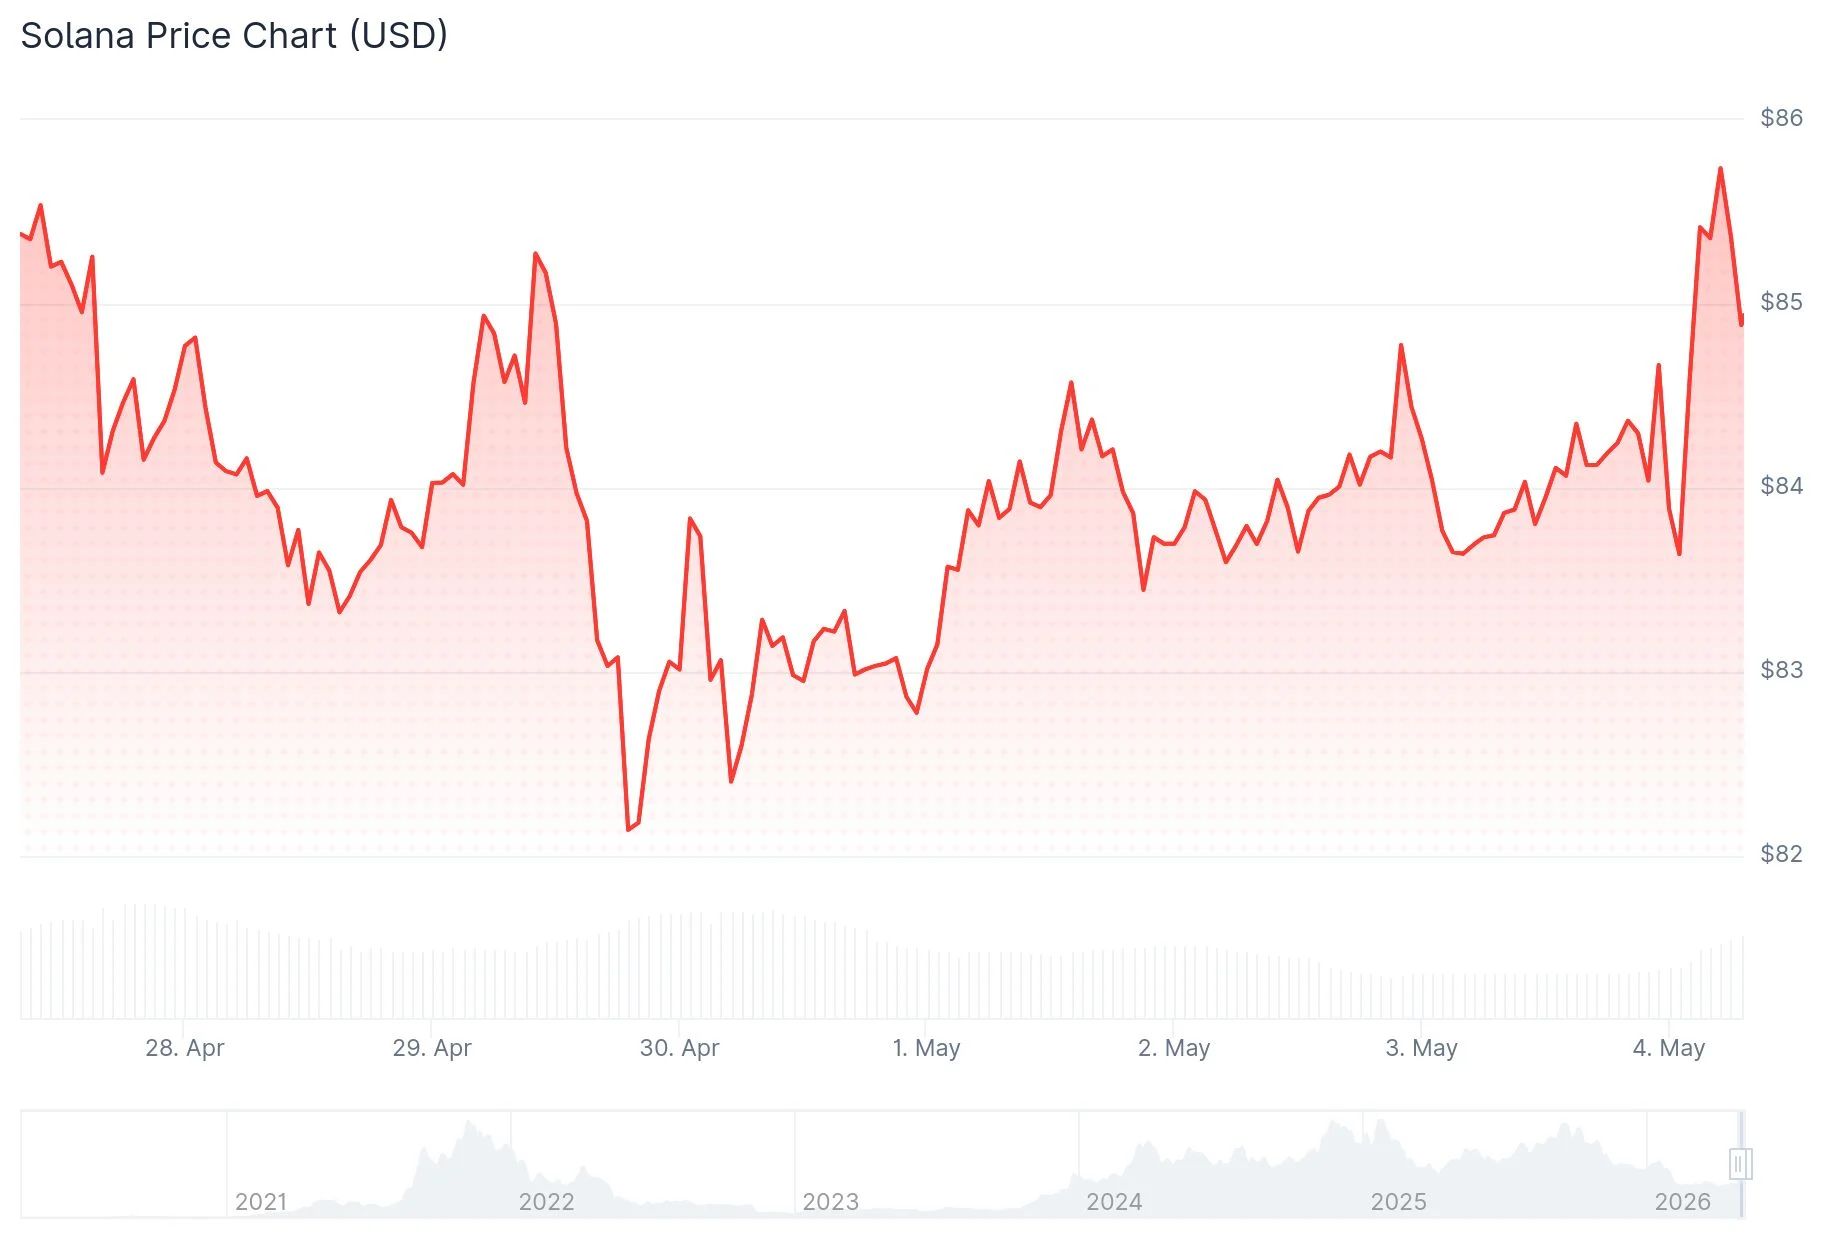
- SOL currently sits at $84, reflecting a 2.35% weekly decline, with its market capitalization standing at $48.45 billion.
- The network dominates Layer 1 and Layer 2 competitors in both decentralized exchange volume and DApp-generated revenue.
- Open interest climbed marginally to $4.84B, while trading activity fell 26.79%, signaling market hesitation.
- Critical price barriers exist at $88.77 on the upside and $81.94 on the downside, with momentum indicators showing weakness.
- Crypto analyst CryptoJack highlighted the coming days as pivotal for determining whether SOL breaks through or faces further rejection.
Solana continues to consolidate around the $84 mark following its steep descent from February’s peak of $140. The asset has entered a narrow consolidation phase while market participants await a definitive directional signal.
Data from CoinMarketCap indicates SOL is valued at $84.07 with daily transaction volume reaching $2.41 billion and a fully diluted market cap of $48.45 billion. The cryptocurrency has shed 2.35% across the past week.
Demand has emerged consistently in the $82 to $83 range, establishing this zone as a crucial near-term foundation. On May 1, analyst BitGuru identified this level as technically significant, emphasizing that sustained buying pressure from spot markets—rather than leveraged speculation—is essential to maintain support.
Crypto commentator CryptoJack posed a straightforward query to the community: “Will it break the trendline and hold above it? Or get rejected at resistance and move lower?” — positioning the upcoming week as a crucial juncture for SOL’s trajectory.

Network Fundamentals Show Continued Strength
While price action remains subdued, Solana’s underlying network metrics continue to impress. According to Solana Floor analytics, the blockchain outpaces all competing Layer 1 and Layer 2 platforms in both daily and weekly decentralized application revenue and DEX transaction throughput.
The network’s minimal transaction costs combined with rapid finality continue attracting substantial high-frequency trading and decentralized finance operations. This sustained activity keeps Solana at the forefront of blockchain usage metrics despite its sideways price movement.
Futures Market and Technical Analysis
In derivatives markets, open interest registered a modest 0.09% increase to $4.84 billion, while trading volume contracted by 26.79% to $4.45 billion. Coinglass reports an OI-weighted funding rate of -0.0073%, indicating slight bearish positioning among perpetual futures participants.
Solana remains positioned beneath its 20-day simple moving average, while the MACD indicator hovers near the zero line with minimal directional strength. The immediate upside barrier stands at $88.77, while downside protection exists at $81.94.
Liquidation mapping reveals concentrated short positions between $84 and $87. A move into this territory could spark cascading liquidations, though sustained momentum above the $88 to $90 range would be required to validate any bullish continuation.
Exchange-traded fund flows contribute to the cautious outlook. SOLZ recorded a $585,473 outflow on May 1. Throughout April, Solana-focused ETFs accumulated just $38.7 million in net inflows—marking the weakest monthly performance despite approaching $1 billion in cumulative inflows.
The Bitwise Solana Staking ETF (BSOL) stood as an outlier, attracting $6.2 million on April 24, representing approximately 1% of its $611.8 million in total assets.
SOL must recapture the $106.24 level before broader bullish momentum can materialize. Currently, the token remains trapped between defended support zones and formidable overhead resistance.