
 Stock: Can SOL Recover After Touching 3-Year Lows at $60?")
Key Takeaways
- SOL has recovered from the $60 support level and currently trades in the $64–$69 corridor, though it remains underneath critical moving averages
- Bearish sentiment dominates derivatives markets: the long-to-short ratio declined to 0.94 while funding rates have shifted into negative territory
- Solana has experienced an unprecedented eight consecutive monthly declines, representing its longest losing streak on record
- Technical analyst BATMAN identifies SOL caught within a symmetrical wedge pattern accompanied by bearish MACD divergence beneath the 200 EMA positioned around $74
- Institutional appetite persists as spot Solana ETFs registered $137,290 in net accumulation on Tuesday
Solana has managed to find footing above the $60 threshold, yet the rebound appears tentative. Currently trading near $69, the cryptocurrency continues to face headwinds from overhead moving averages and multiple resistance barriers.
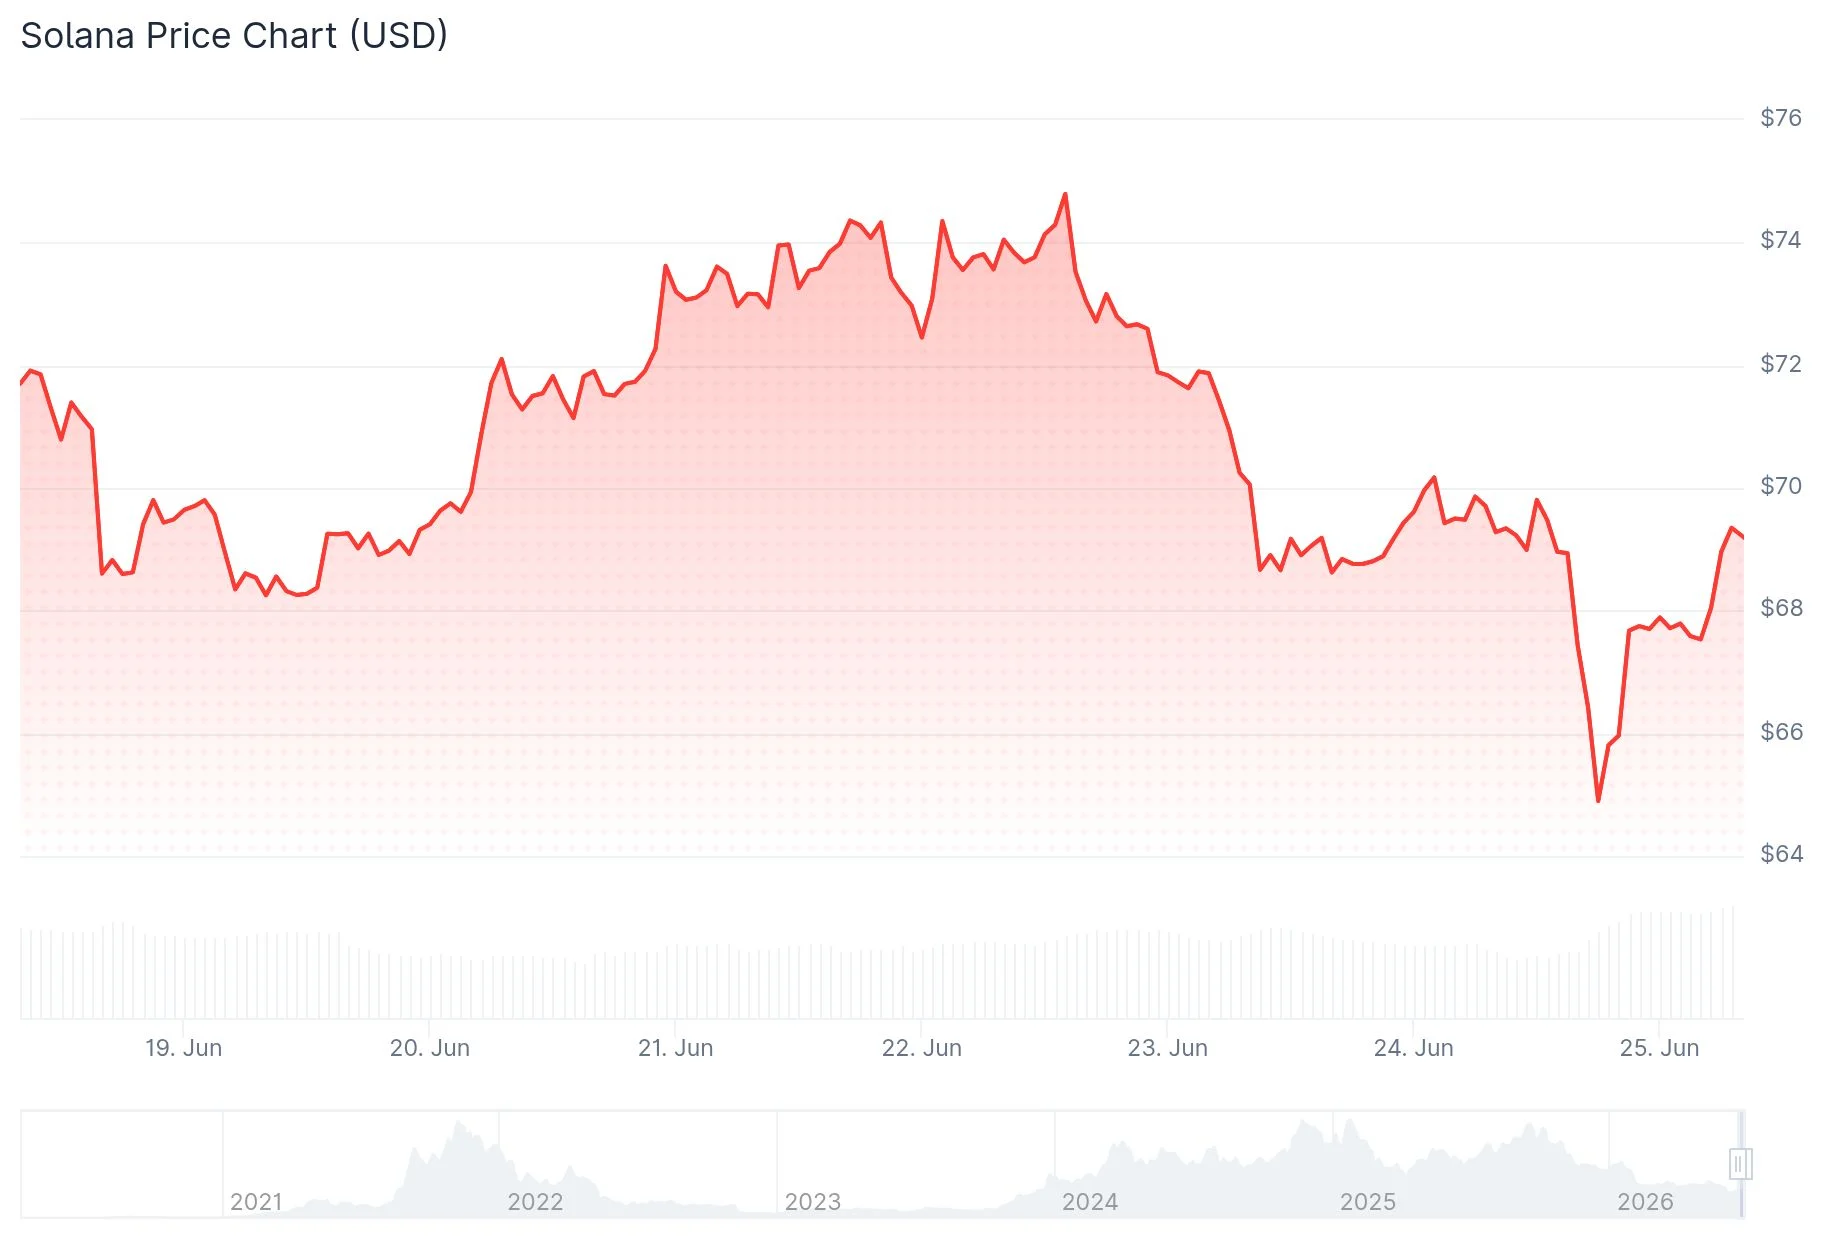
The $60 region has emerged as a critical psychological floor. Demand materialized at this level, propelling SOL upward by more than 5% during a 24-hour period at its peak. However, selling pressure continues to mount at higher price points.
Derivatives market indicators paint a pessimistic picture. According to CoinGlass data, Solana’s long-to-short ratio contracted to 0.94 on Wednesday. When this metric falls beneath 1.0, it signals that short positions exceed long positions, reflecting bearish positioning among market participants.
Funding rates have also deteriorated, turning negative early in the week and registering -0.0080% on Wednesday. Negative funding rates indicate that short sellers are compensating long position holders, a dynamic that generally suggests traders are anticipating further price declines.

On June 24, cryptocurrency analyst BATMAN highlighted that SOL appears confined within an expansive symmetrical wedge formation. Price action is consolidating toward the pattern’s apex while remaining suppressed below the 200 EMA situated near $74. The MACD indicator displays bearish divergence with waning momentum. BATMAN observed that Solana is “running out of room” and posed the question of whether SOL will breach below $69.
Critical Resistance Barriers Ahead
SOL presently trades beneath its 50-day, 100-day, and 200-day exponential moving averages. This creates a layered resistance structure that bulls must overcome.
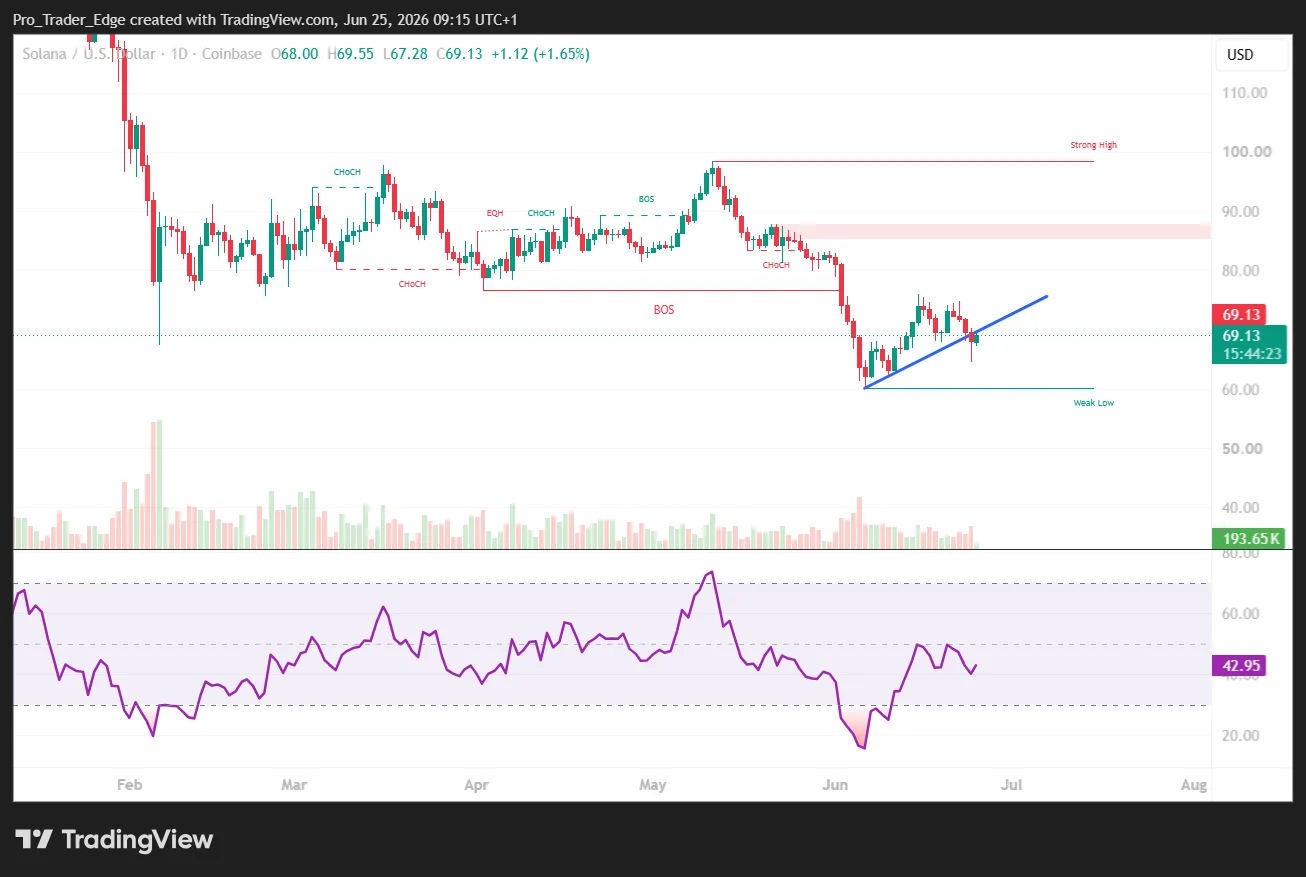
The initial obstacle appears around $74.75. Beyond that lies the 50-day EMA positioned near $76.18. A more substantial advance might challenge the 50% Fibonacci retracement level at $79.27, followed by the 100-day EMA at $83.03.
The MACD on the 4-hour timeframe shows signs of flattening, while the RSI hovers near 46, beneath the neutral 50 threshold. Neither momentum indicator suggests an imminent powerful rally from present levels.
The monthly chart reveals extreme conditions. Analyst Ash Crypto highlighted that SOL has closed in the red for eight consecutive months, an unprecedented occurrence in the asset’s trading history. The monthly RSI has reached deeper oversold territory than witnessed during the November 2022 FTX implosion, when SOL plummeted to approximately $8.
Emerging Support Indicators
Not all signals trend bearish. Spot Solana ETF products attracted $137,290 in net capital inflows on Tuesday, per SoSoValue data. While this represents a relatively small amount, it demonstrates that institutional interest has not completely evaporated.
Certain market observers are monitoring the $50–$40 range as a potential accumulation zone. Rod’s technical projection suggests that if SOL establishes a foundation within this area, a longer-term recovery targeting $175 could materialize. Meanwhile, Trader Symba’s SOL/BTC pair analysis identifies a substantial long-term demand zone in the vicinity, with a perspective toward eventual new peaks above $300.
CryptoJack noted a trendline breakout on the 1-hour chart, indicating early signals that immediate downward momentum may be weakening. Essential support levels to maintain are $62–$63, with upside objectives positioned at $68, $70, and subsequently $76.
As of Wednesday, SOL’s long-to-short ratio remained at 0.94 while funding rates held at -0.0080%, with the asset trading around $69.58.