
 Stock Maintains $2,300 Support Amid Diverging Whale and Retail Activity")
Key Highlights
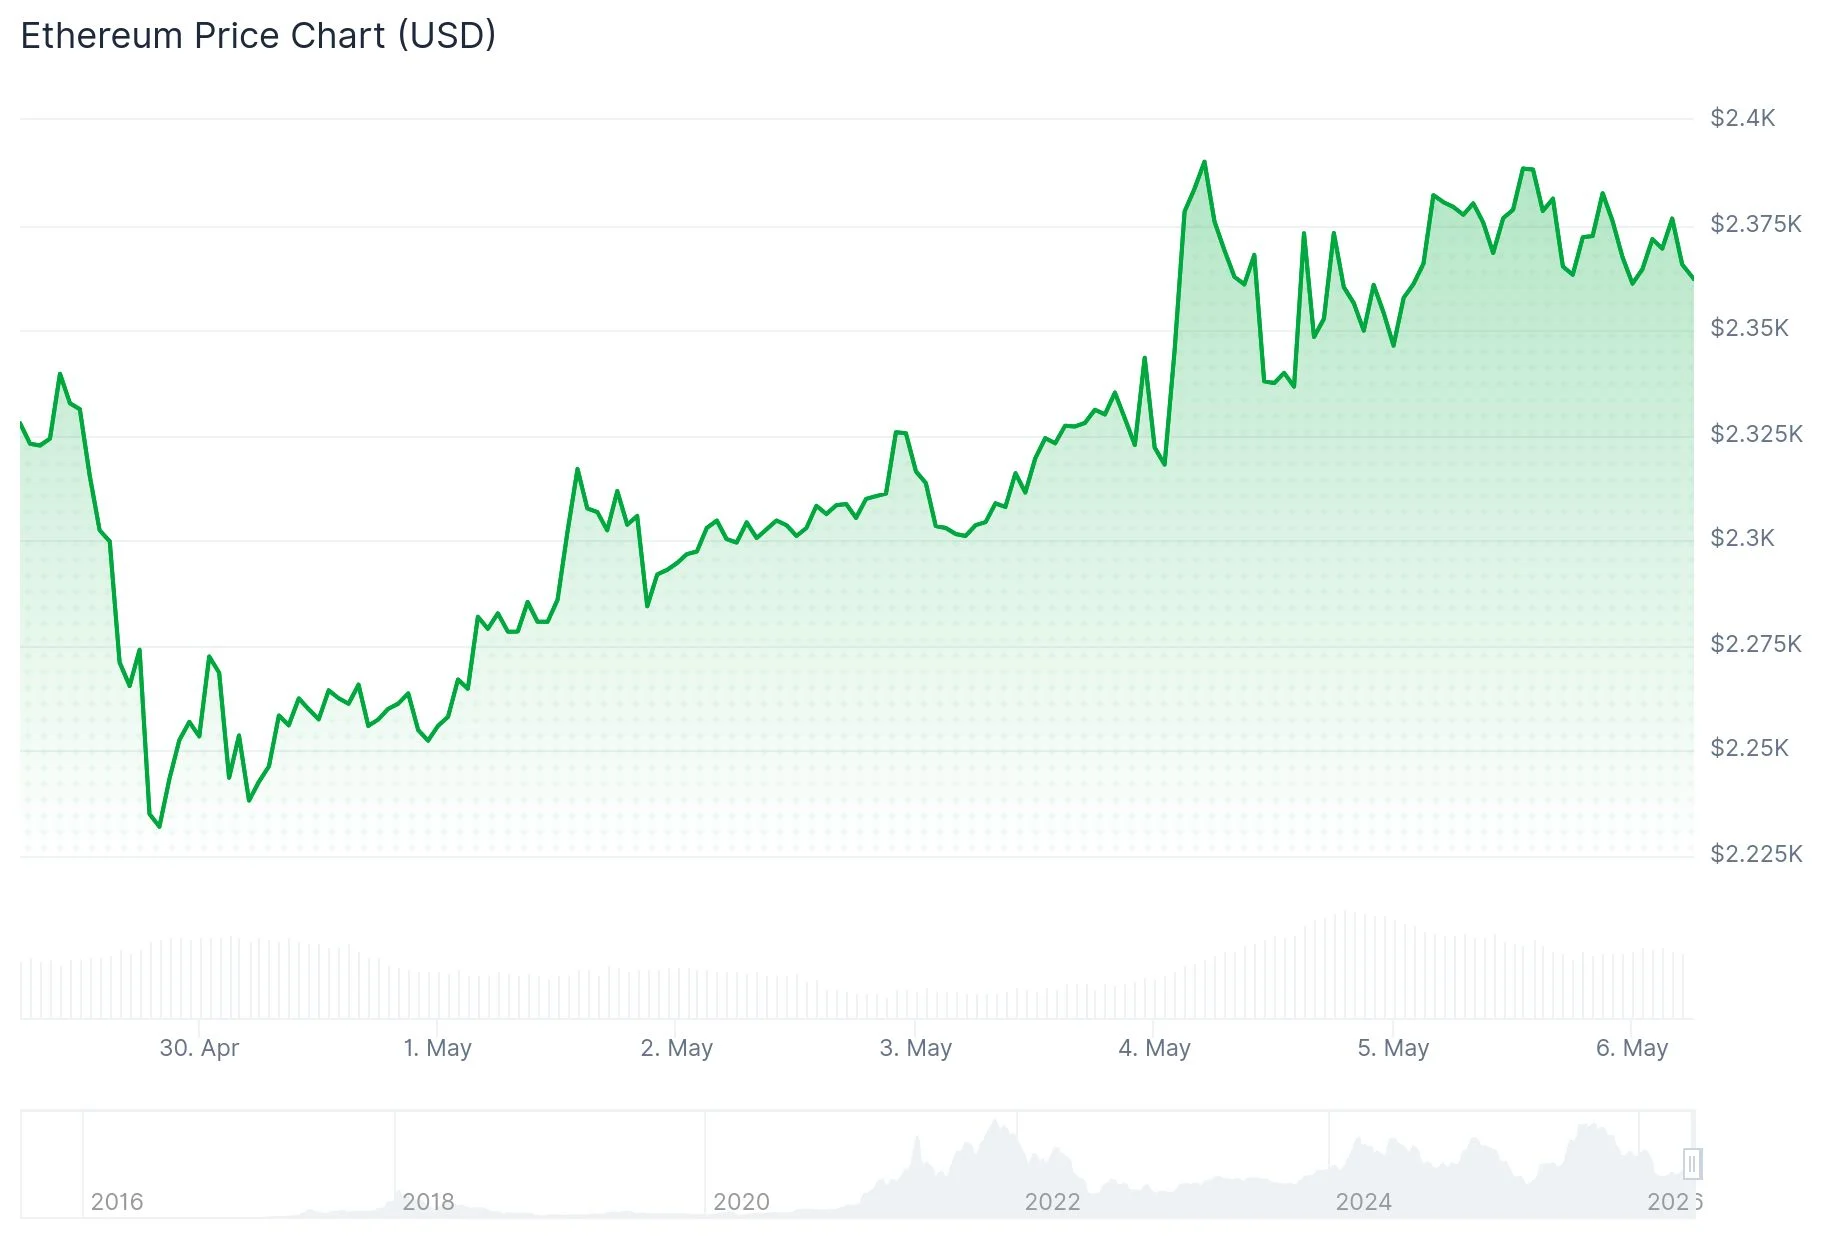
- Ethereum is currently changing hands around $2,370–$2,380, reflecting a 0.8% daily increase and over 3% weekly gains
- Smaller holders have offloaded approximately 1.5 million ETH during a two-week period
- Large wallet addresses absorbed 230K ETH in the previous week, offsetting retail distribution
- April witnessed exchange outflows decline to their lowest point in eight months, suggesting investor caution
- Critical price barriers exist at $2,388–$2,400, while the 200-period simple moving average stands at $2,680
Ethereum continues to defend the $2,300 threshold as of Tuesday, with spot prices hovering between $2,370 and $2,380. The leading altcoin has posted a 0.8% advance in the past 24 hours and climbed more than 3% across the weekly timeframe.
While the seven-day performance appears positive, blockchain data reveals a more nuanced picture of market dynamics.
Addresses containing between 100 and 10,000 ETH have liquidated approximately 820K tokens during the past week. Extending the observation period to two weeks shows this retail segment has distributed nearly 1.5 million ETH collectively.
The 90-day Mean Coin Age indicator has experienced a notable decline, pointing to increased movement from newer holders rather than established long-term participants.

Staking behavior reinforces this pattern. Network participants withdrew roughly 300K ETH from staking contracts last week—marking the most significant single-week exodus since November.
In derivatives markets, perpetual swap funding rates for ETH have stayed predominantly negative throughout the past 30 days. Although open interest has climbed above the 14 million ETH threshold, futures market sentiment remains measured.
Large Holders Counter Retail Distribution
While smaller wallets have reduced exposure, institutional-sized addresses are taking the opposite approach. Whale-tier participants accumulated roughly 230K ETH during the previous week, creating a counterbalance to retail selling.

Ethereum experienced $38.7 million in forced liquidations over the last 24-hour period. Short position liquidations accounted for $26.1 million of this total, providing upward momentum for price action.
Market observer Ali Charts identified a golden cross pattern forming between the 50-period and 100-period simple moving averages on Ethereum’s technical chart, suggesting potential movement toward the 200 SMA positioned at $2,680. Meanwhile, analyst Ted Pillows expressed a more reserved perspective, highlighting that ETH has repeatedly struggled to sustain moves above the $2,400 mark and that downside exposure remains elevated until this threshold is decisively overcome.
Platform Outflows Reach Eight-Month Bottom
April recorded ETH exchange withdrawals at their weakest level since September 2024. Approximately 19.8 million ETH exited trading platforms throughout the month. Binance accounted for the largest share with 7.09 million ETH, while OKX recorded 2.4 million and Coinbase Prime registered 1.62 million in outflows.
The reduced withdrawal activity implies certain market participants are maintaining their holdings on exchanges instead of transferring to self-custody solutions. This behavior pattern reflects a cautious stance rather than decisive long-term conviction.
From a technical perspective, ETH has successfully reclaimed the $2,200–$2,300 support corridor and established a sequence of ascending troughs since February. The 50-week and 100-week moving averages occupy the $2,500–$2,800 zone and currently function as overhead resistance levels.
Ethereum is now testing the $2,388 resistance barrier. The price structure remains positioned beneath both weekly moving average benchmarks.