
 Stock: TD Sequential Signals Reversal as Whales Scoop Up 250M Tokens")
Key Takeaways
- Cardano is hovering near $0.25 following a five-session decline, showing a modest 0.68% gain on Wednesday.
- Large holders have accumulated approximately 250 million ADA tokens starting May 11, indicating sustained confidence.
- Derivatives data reveals a long-to-short ratio of 0.80, suggesting bearish positioning dominates current market sentiment.
- Technical indicators show ADA trading beneath its 50-, 100-, and 200-day exponential moving averages, with RSI at 43 and bearish MACD readings.
- Technical analyst Ali Charts identified a TD Sequential buy formation, projecting initial resistance at $0.255 while emphasizing $0.246 as critical support.
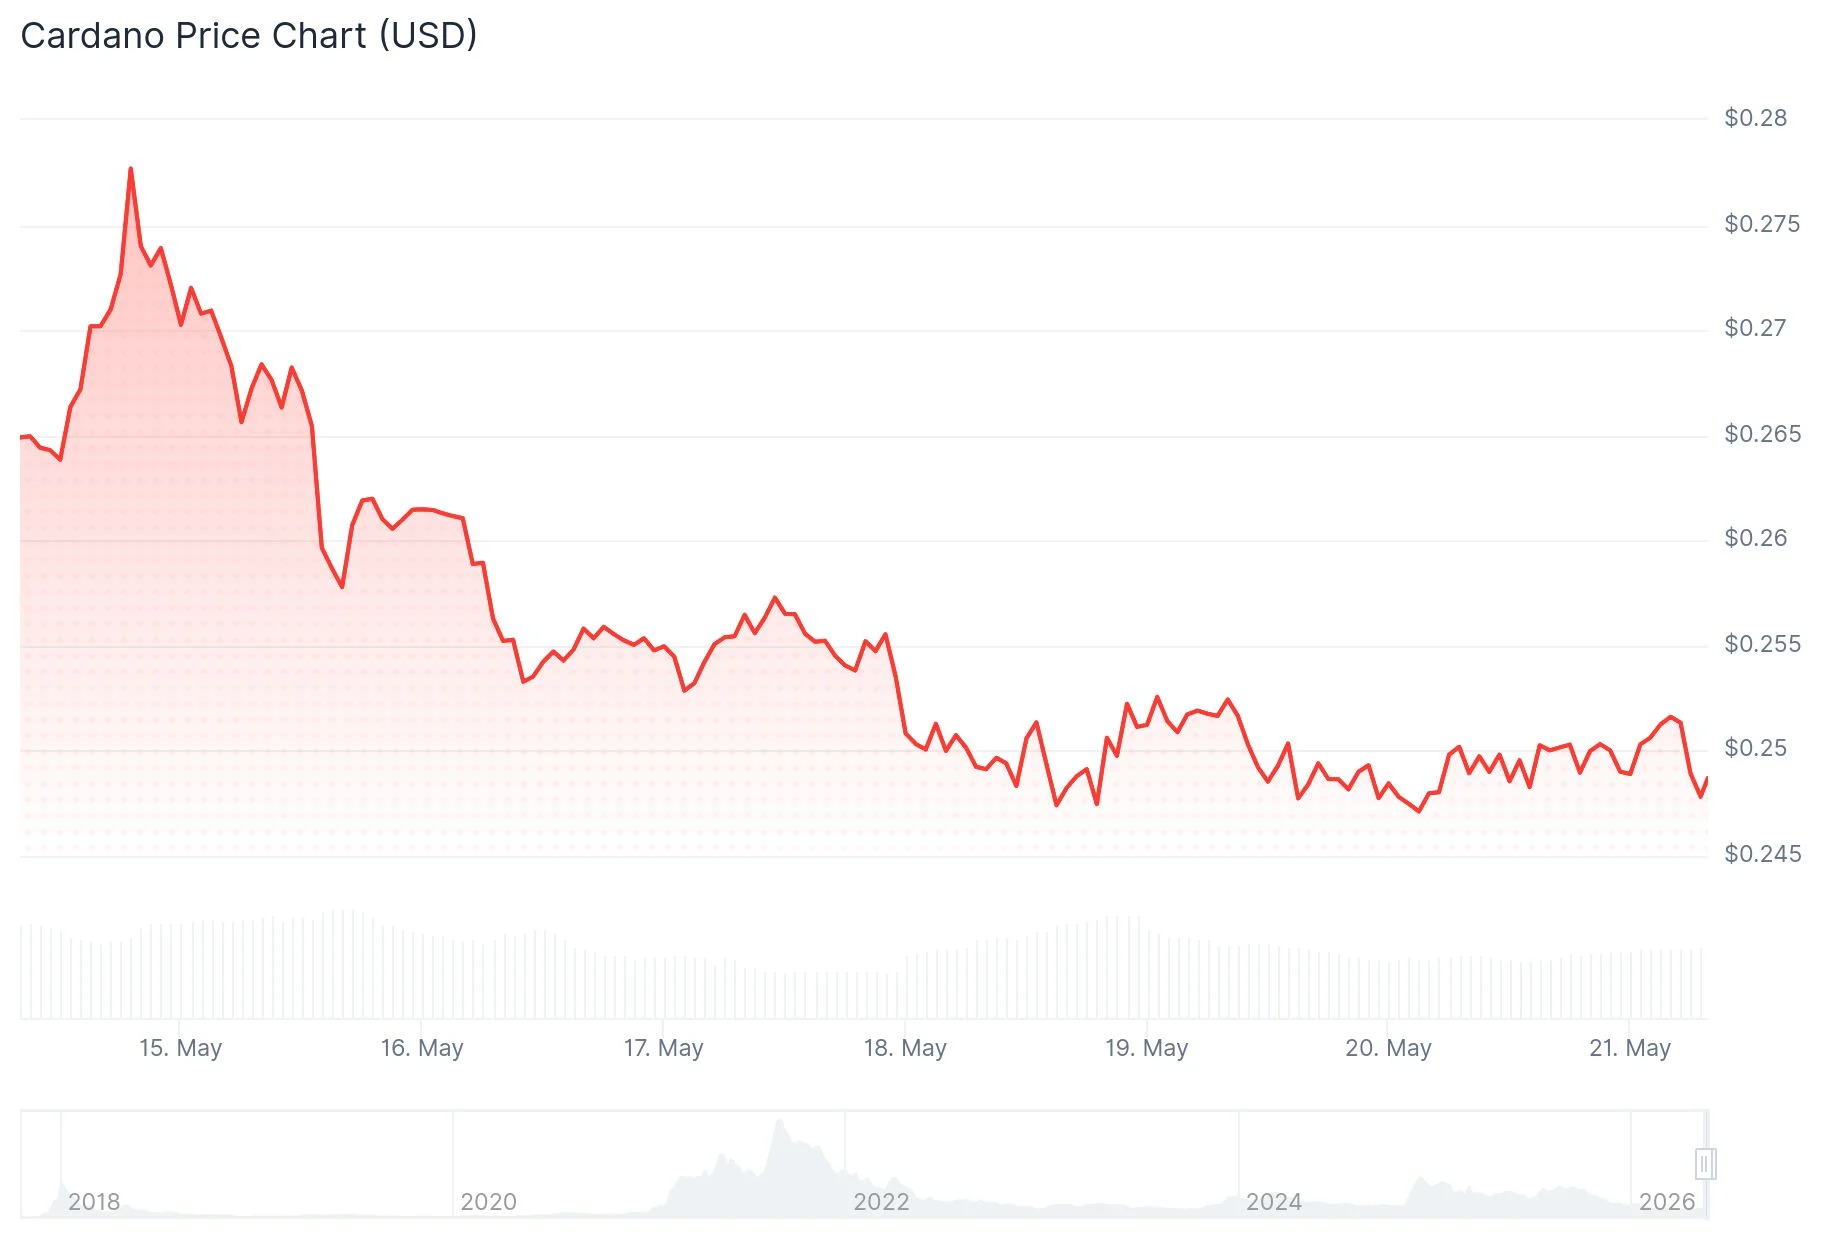
Cardano (ADA) is showing signs of stabilization following a streak of five consecutive losing sessions. Currently priced at approximately $0.2499, the cryptocurrency has registered a modest 0.68% uptick over the last 24 hours. However, the overall technical landscape continues to face headwinds.
Blockchain analytics platform Santiment reveals compelling on-chain activity from major token holders. Addresses controlling between 100,000 and 100 million ADA have collectively acquired roughly 250 million tokens beginning May 11. This substantial accumulation during price weakness typically indicates institutional or high-net-worth conviction in the asset’s future prospects.
Cryptocurrency analyst Ali Charts shared on X (formerly Twitter) that the TD Sequential indicator—which accurately predicted the 15% decline from May 10—has now generated a buy signal. According to his analysis, a potential local floor may be establishing, with the first upside objective at $0.255 and a subsequent target at $0.262. Critically, he emphasized that daily closes must remain above the $0.246 threshold to validate this bullish scenario.
Momentum Indicators Remain Challenged
Cardano currently trades beneath three significant exponential moving averages: the 50-day at $0.258, the 100-day at $0.280, and the 200-day at $0.355. The Relative Strength Index registers at 43, while the MACD indicator persists in negative territory. These metrics collectively signal subdued momentum and indicate that any upward movements may encounter swift resistance.

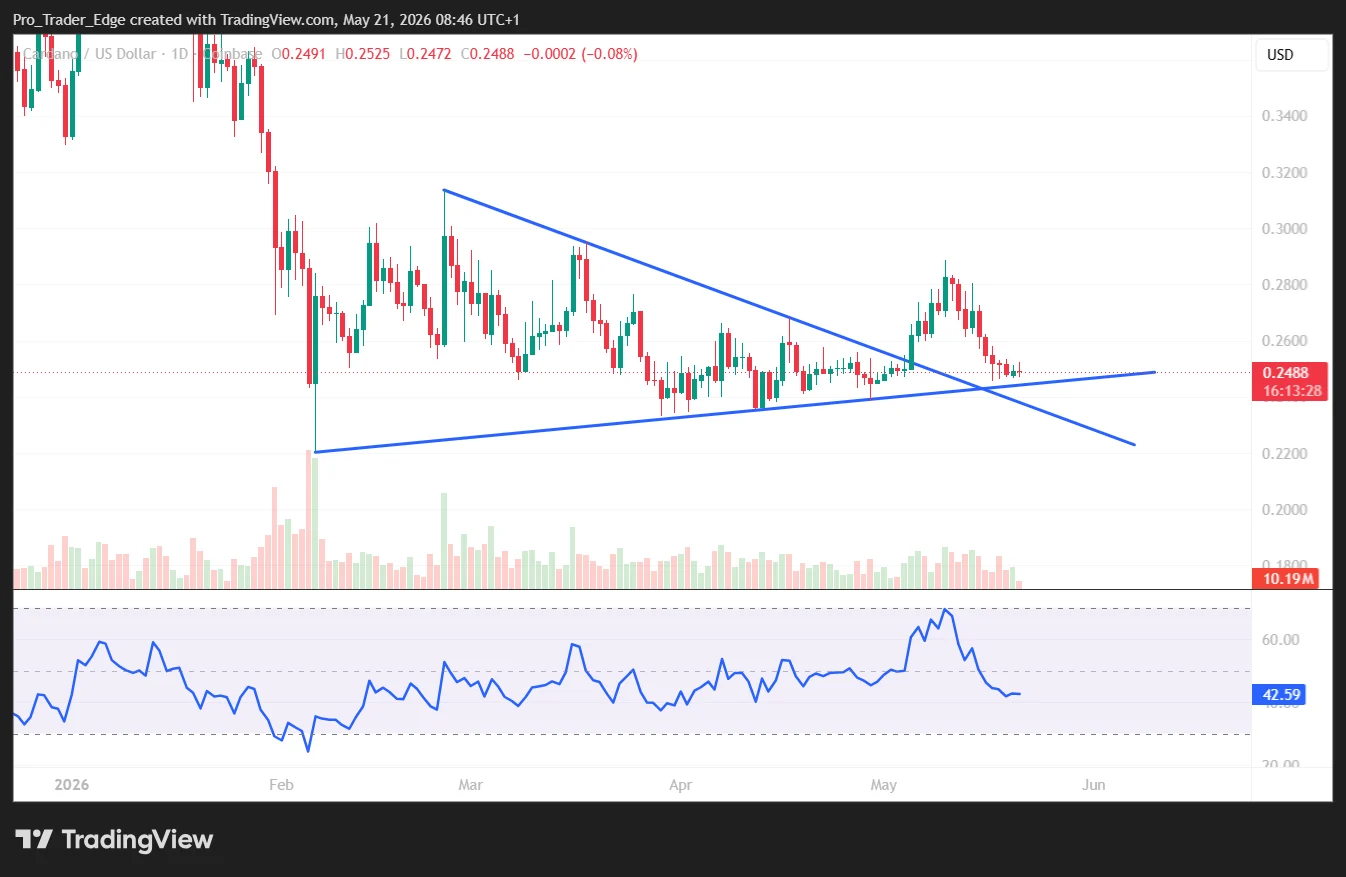
Bollinger Band analysis shows ADA consolidating around the median line, maintaining position above the lower boundary near $0.2393. While this prevents a complete structural breakdown, it doesn’t constitute a bullish configuration either.
Critical overhead resistance zones include the 50-day EMA at $0.258, the 23.6% Fibonacci level at $0.271, and a descending trendline around $0.274. Downside protection exists at $0.245, followed by $0.236, with a more substantial floor near the February trough at $0.220.
Real-World Asset Development Strengthens Fundamentals
The Cardano Foundation recently unveiled a comprehensive Real-World Asset (RWA) tokenization case study via Cardano Academy. The publication demonstrates how tangible assets can be tokenized leveraging Cardano’s current technological framework. This initiative represents part of the ecosystem’s strategic expansion into practical blockchain applications.
Derivatives market data presents a nuanced picture. CoinGlass reports the long-to-short ratio at 0.80, marking its lowest reading in more than a month. Simultaneously, the open interest-weighted funding rate shifted positive on Sunday, currently standing at 0.0072%. This indicates long position holders are compensating short sellers, suggesting a subtle improvement in market sentiment.
The $0.246 support threshold highlighted by Ali Charts remains the pivotal level for monitoring as the next daily candle close approaches.