
 Stock: Historic Rally Indicator Returns as BTC Consolidates Above $80K")
Key Highlights
- A potential “golden cross” in Bitcoin’s MVRV ratio is forming, a pattern that has historically signaled significant upward price movements.
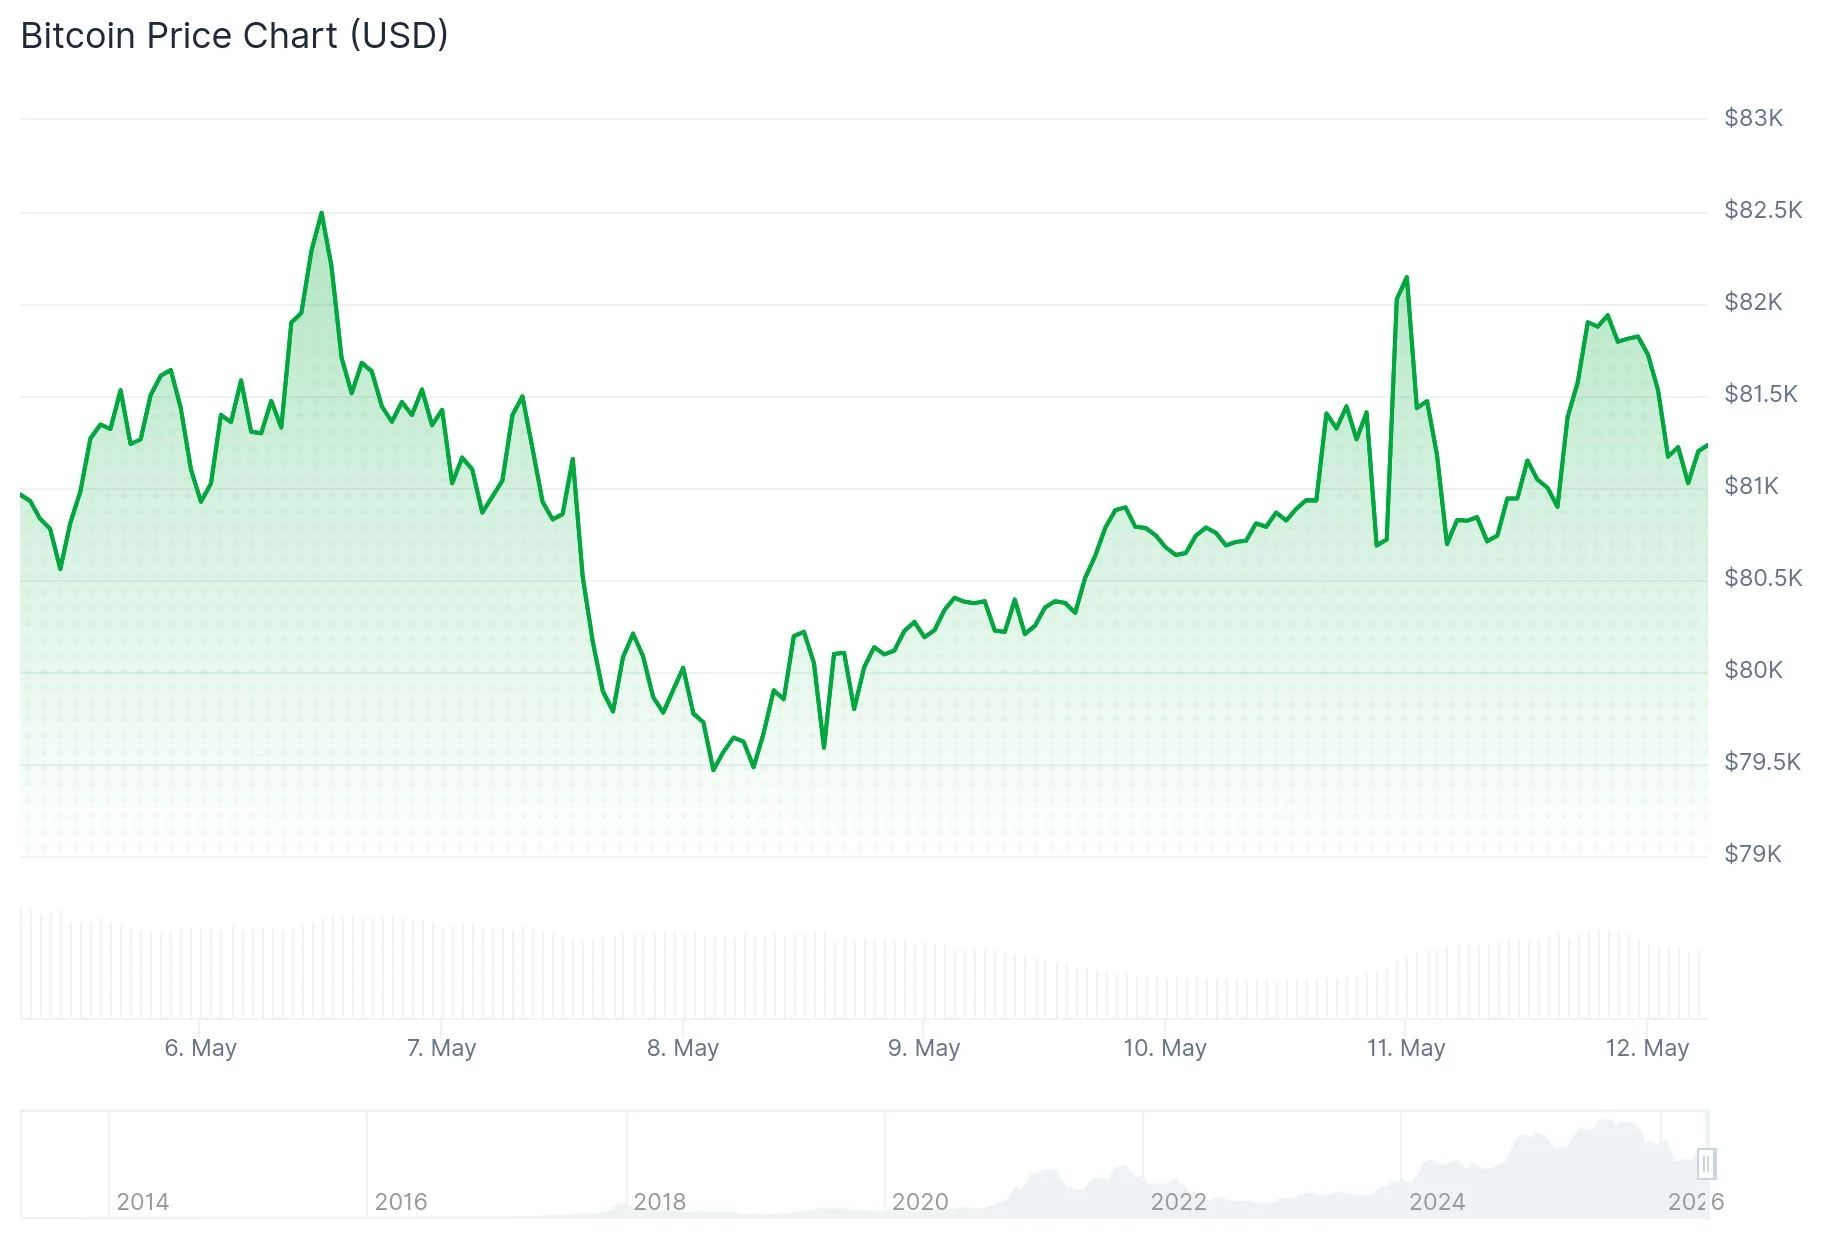
- Bitcoin maintains consolidation within the $80,500–$82,000 range as it tests critical near-term resistance zones.
- The short-term holder cost basis shows a “heated” threshold at $92,000, while the “overheated” level stands at $104,000.
- Market analyst Daan Crypto Trades highlighted a strong weekly closure above the bull market support band, identifying the $82K daily 200MA as crucial resistance.
- Spot Bitcoin ETFs saw $623 million in net inflows during the previous week, extending the positive flow streak to six weeks.
A significant technical development is unfolding for Bitcoin as the MVRV ratio edges closer to a rare “golden cross” formation, while trading activity remains concentrated around the $82,000 resistance zone.
The MVRV (Market Value to Realized Value) metric serves as a valuation tool to determine if Bitcoin is trading above or below its fair value. CryptoQuant analyst CW8900 identified an approaching golden cross between the MVRV ratio and its 200-day exponential moving average. The analyst characterized this development as “a representative trend reversal signal and is a bullish indicator.”
Historical precedent shows this pattern has emerged on two prior occasions. Following the 2022 market bottom, the initial crossover sparked a 90% price surge from $16,300 to $31,000. The second occurrence in September 2023 catalyzed a massive 400% advance to Bitcoin’s all-time peak of $126,000 in October 2025.
CW8900 further observed that Bitcoin’s 30-day simple moving average crossed above the 90-day SMA in late April, commenting: “BTC has completely turned to a bullish trend.”

Technical Analysis and Institutional Capital Flows
Cryptocurrency trader Daan Crypto Trades shared on X that Bitcoin achieved a “solid weekly close above the bull market support band,” noting that a successful breakout above the daily 200MA/EMA near $82K would represent “a signal of strength for further continuation.”
Concurrently, SoSoValue reported in their weekly analysis that Bitcoin ETFs accumulated $623 million in net inflows throughout the week, representing the sixth consecutive week of positive flows. They characterized the movement as a “week of layered capital allocation” rather than an aggressive risk-on environment, observing some short-term profit realization alongside sustained institutional accumulation.
Trader Shib Spain observed that BTC successfully breached a multi-month descending trendline on the weekly timeframe, highlighting a MACD bullish reversal as technical confirmation. Analyst Moustache pointed out that the Bitcoin market cap RSI rebounded from multi-year monthly support levels, declaring: “Prices will go much, much higher.”
Current Trading Dynamics and Critical Price Zones
Bitcoin struggled to maintain elevation above $81,500 and experienced a retracement, presently trading above $80,500 and the 100-hour simple moving average. A narrowing triangle formation has developed on the hourly timeframe, establishing support at $80,800.
Should BTC successfully breach $81,800 and $82,000, subsequent resistance targets include $82,250, $82,500, and $83,500. Conversely, critical support zones are positioned at $80,400, followed by $79,400, and $78,500.
The short-term holder cost basis “heated” threshold remains at $92,000, with the “overheated” marker sitting at $104,000. Despite evidence of some profit-taking activity, on-chain analytics from Glassnode indicate that price action has potential for additional upward movement in the near term.
Bitcoin ETF inflows totaling $623 million throughout the past week represent six straight weeks of positive institutional capital deployment, with long-term allocation strategies remaining intact despite a brief two-day outflow period concluding last week.