
 Stock Surges 23% From June Bottom — Will $80 Prove Too Strong?")
Key Highlights
- Approximately 600,000 SOL have moved to centralized exchanges, indicating potential selling pressure or hedging activity from holders.
- Technical analyst Ali Charts identified a TD Sequential sell signal appearing on the 4-hour timeframe, with critical resistance positioned at $74.65 and the 200 SMA near $75.
- The token currently sits around $74, marking a roughly 23% climb from June’s $60 bottom.
- Maintaining position above $73 remains crucial for sustaining the recovery narrative.
- Market observers identify $80–$82 as the next significant resistance barrier, while $50 represents deep support territory below.
Solana (SOL) has positioned itself near $74 following an impressive 23% rebound from the $60 level touched in June. This recovery emerged after a brutal selloff earlier in the month dragged prices significantly beneath a crucial support zone that had remained intact for several months.
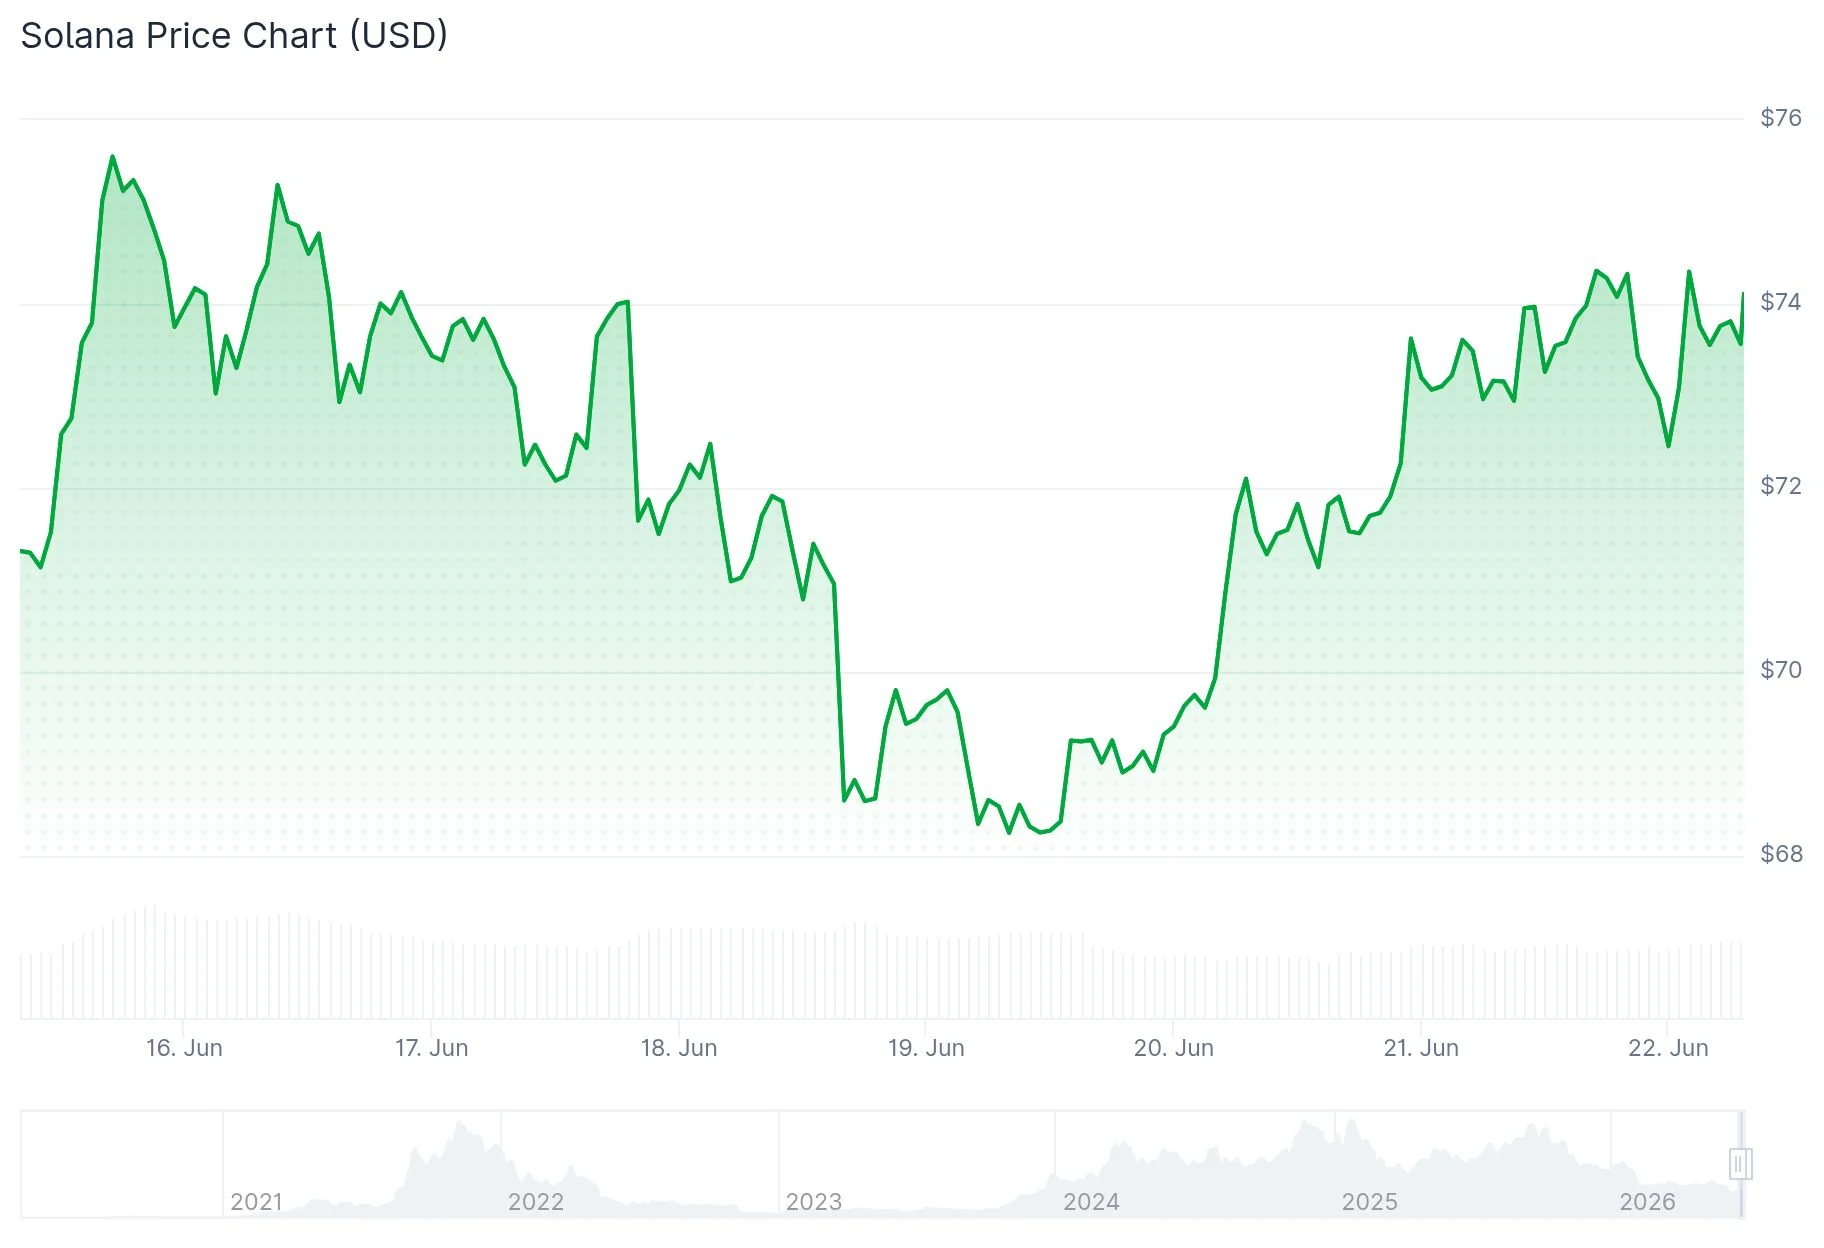
The cryptocurrency’s 24-hour trading volume currently registers at $1.89 billion, while its market capitalization stands at $42.96 billion. Over the past day, SOL has recorded a 3.08% price increase.
Cryptocurrency analyst Ali Charts posted on X that after a TD Sequential buy signal triggered last Friday, SOL rallied 8.40% from $68.46 to reach a peak of $74.27. Ali Charts also warned that a fresh sell signal has emerged on the 4-hour chart, with price now confronting resistance at $74.65. This level coincides with the 4-hour 200 SMA positioned at $75, creating what Ali Charts characterized as a “highly concentrated technical ceiling.” Should price reject from this area, potential pullback targets include $71, with an extended decline possibly reaching back to $68.46.
In a separate observation, Ali Charts’ blockchain data reveals that roughly 600,000 SOL tokens have recently transferred into centralized exchanges. Significant inflow surges of this magnitude typically indicate that holders are positioning to liquidate or establish hedges, potentially generating near-term downward pressure on price.

Critical Price Levels Under Observation
Between February and May, the $73 mark functioned as Solana’s primary support foundation. When price broke beneath this threshold in June, it transformed into resistance. A daily closing price back above $74 would indicate the June breakdown was merely a bear trap. Inability to maintain these levels could drive price back toward the $60 region.
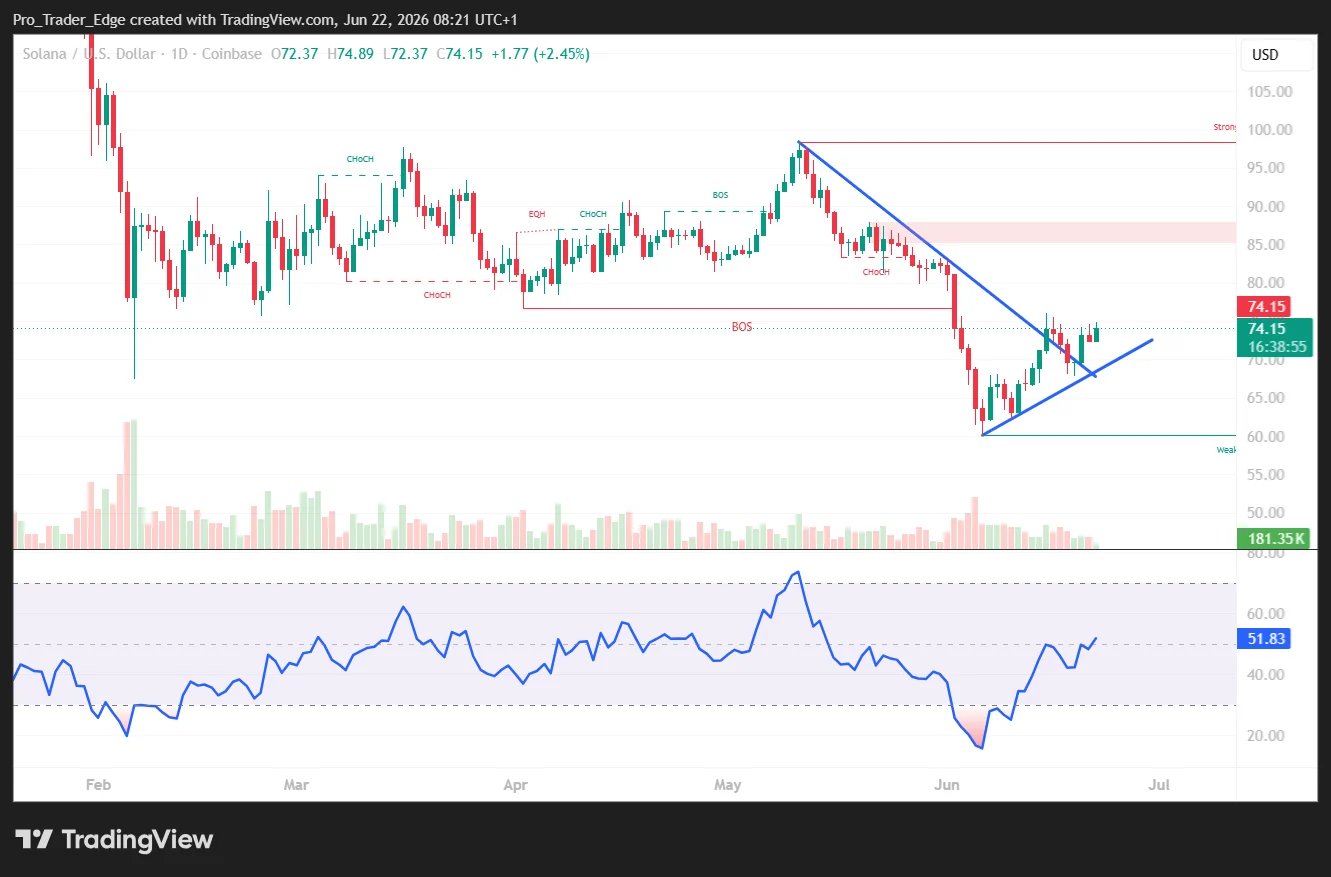
The Relative Strength Index plummeted to approximately 21 during June’s selloff, reflecting deeply oversold conditions. It has since climbed to 48.45, with its signal line positioned at 39.77. Analysts suggest this configuration could precede a more pronounced directional movement in the near term.
Analyst BitGuru emphasized that SOL rebounded from a significant reversal area where sellers had previously maintained control. Buyers have subsequently entered and stabilized price movement, which BitGuru interprets as consistent with accumulation patterns rather than the beginning of an extended bearish trend.
Analyst Altcoin Sherpa has recommended caution, stating SOL remains “trash on high time frames” until it demonstrates a structural transformation. He’s awaiting a definitive reclaim of $77 before entertaining long position opportunities.
Overhead Resistance and Downside Support
The 50-day simple moving average rests at $79.85, a metric that has tracked Solana’s trend direction since February. Breaking above this threshold would bring $90 into potential reach.
Analyst EliZ is tracking the $82–$90 weekly supply zone, characterizing it as transitioning from resistance to support. He maintains a bullish stance on Solana’s ecosystem but awaits broader market momentum for confirmation.
Should the current recovery stumble and price falls beneath $73, the subsequent area of focus becomes the $67–$68 range. A daily close under $60 would completely invalidate the bullish recovery scenario, with $50 identified as substantial support further below.
SOL currently tests resistance around $74.65, with the 4-hour sell signal and substantial exchange inflows suggesting possible near-term consolidation before the next significant directional movement materializes.