
 Stock Tumbles to 15-Week Low as Bearish Momentum Intensifies")
Key Takeaways
- XRP plunged to a 15-week bottom around $1.2677, declining more than 66% from its latest high
- The digital asset now trades beneath $1.280 and the 100-hour Simple Moving Average
- Critical resistance emerges at $1.3150; breaking past $1.340 may trigger movement toward $1.3550
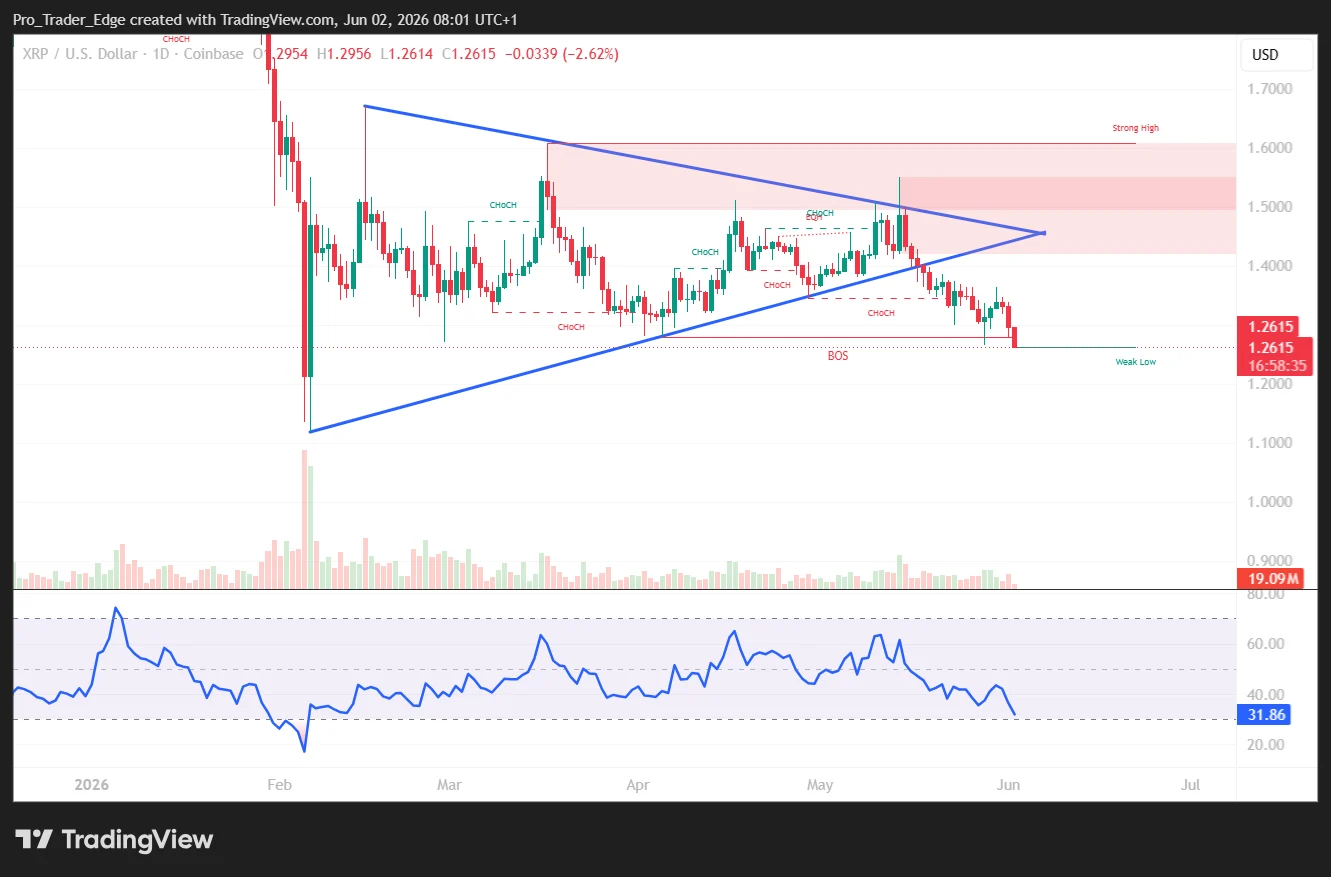
- Technical analyst ChartNerdTA identified two unsuccessful rally attempts following a “deathcross” pattern in November 2025
- Strategic accumulation ranges noted between $1.10–$1.30, with additional support identified at $0.65–$0.85
XRP has entered bearish territory following its inability to maintain levels above $1.320, sliding to a 15-week bottom near $1.2677. This downturn coincides with broader cryptocurrency market weakness, as both Bitcoin and Ethereum face comparable selling pressure.
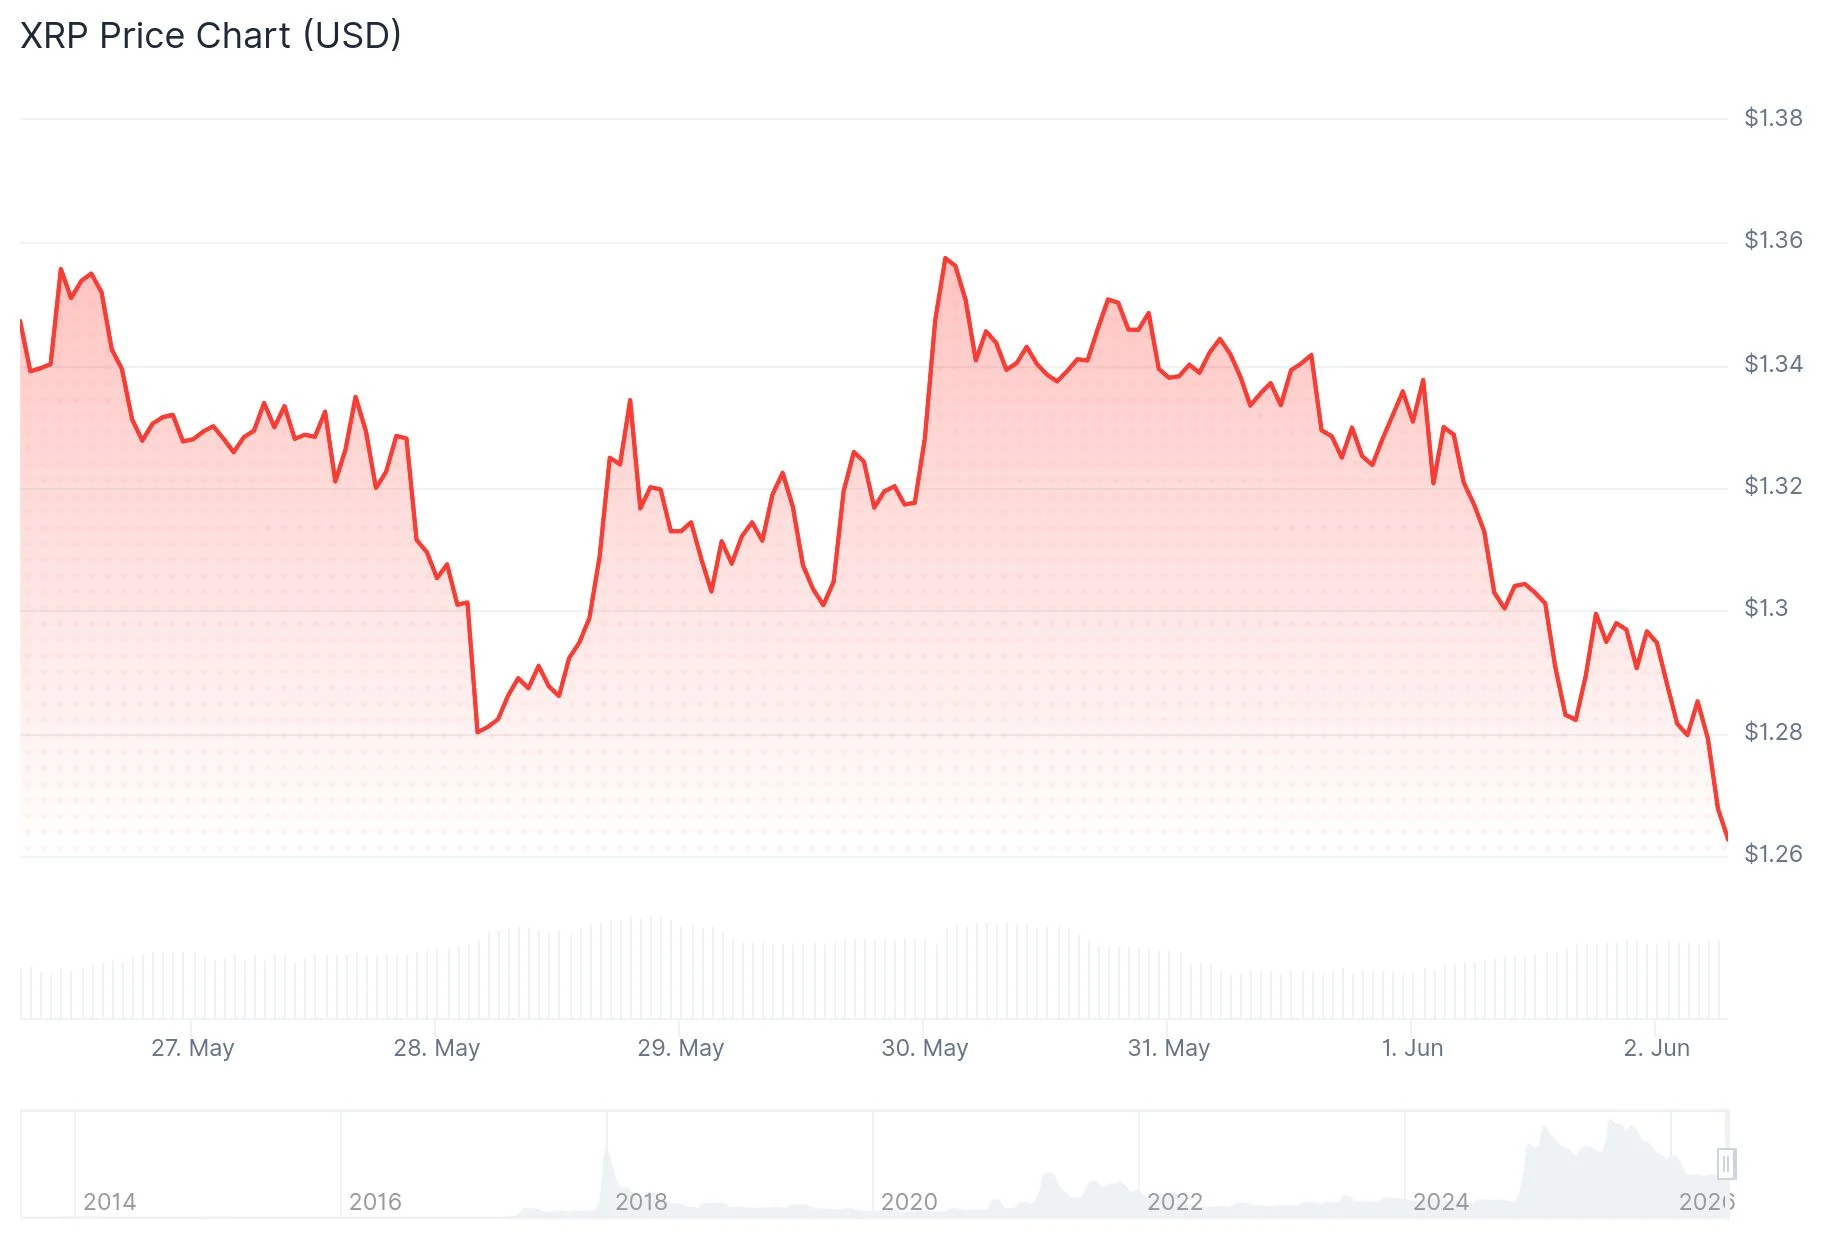
The cryptocurrency has now pushed losses beyond $1.2880 and continues trading beneath its 100-hour Simple Moving Average. The asset touched a bottom at $1.2752 and remains consolidating within that vicinity.
Currently, XRP trades below the 23.6% Fibonacci retracement level calculated from the upward move between the $1.3642 peak and the $1.2752 trough. This positioning indicates technical vulnerability.
Regarding upside potential, initial resistance appears near $1.2920, with secondary resistance at $1.2960. The primary resistance barrier stands at $1.3150, which corresponds with the 50% Fibonacci retracement of the decline from $1.3638 down to $1.2677.

Should XRP secure a decisive close above $1.320, the path could open toward $1.3275 and subsequently $1.340. Additionally, a descending trend line has formed on the hourly timeframe, presenting resistance around $1.340.
Bearish Control Established Since End of 2025
Technical analyst ChartNerdTA via X highlighted that $XRP has experienced two unsuccessful upward attempts since a 5-day 20/50 EMA “deathcross” materialized in November 2025. The initial rally peaked near $2.40 at the 50 EMA in January before collapsing to $1.11. The subsequent rally met rejection at the 20 EMA around $1.54 in May — both instances confirming descending highs and sustained downward momentum.
The comprehensive decline from the latest peak now represents roughly 66%, a significant retracement prompting traders to reconsider potential support zones where XRP might stabilize.
One market analyst pinpointed the $1.10–$1.30 bracket as a viable accumulation territory for investors seeking to establish positions incrementally. The recommendation emphasizes dollar-cost averaging rather than deploying full capital immediately.
Additional Support Levels Under Observation
Should the $1.10–$1.30 zone prove inadequate, the subsequent support region highlighted by market watchers extends between $0.65 and $0.85. These levels represent more robust demand areas according to historical price behavior.
Extended price objectives of $5, $10, and $15 have surfaced in technical discussions, referencing a prior accumulation phase that preceded an 835% surge.
On the downside trajectory, if XRP breaches $1.2550, subsequent levels for consideration include $1.2320 followed by $1.220. A breakdown below $1.20 would establish conditions for additional declines.
Current market data indicates XRP consolidating marginally below $1.280, with bearish forces maintaining dominance over the near-term trajectory.