
 Stock: TD Sequential Flashes Buy Signal on 3-Day Chart With $2.39-$3.11 Upside Target")
TLDR
- XRP maintained the $1.10 support threshold on June 11, hovering around $1.12 following increased late-day trading activity
- An Elliott Wave impulse formation suggests potential recovery toward $2.39-$3.11 range
- Technical analyst Ali Charts identified a TD Sequential buy indication on the 3-day timeframe, signaling possible near-term bounce
- Investment vehicles tracking XRP attracted $1.19 million in net daily flows, pushing aggregate assets toward $948.98 million
- Critical overhead resistance established at $1.12–$1.13, with the middle Bollinger Band at $1.2380 representing the next significant hurdle
XRP preserved its position above the $1.10 threshold throughout June 11 amid turbulent market conditions, settling near $1.12 with approximately $1.94 billion in 24-hour trading volume. The digital asset posted a modest 0.72% daily gain while experiencing a 4.47% weekly decline and a 23.86% monthly retreat. Its market capitalization hovered around $69.2 billion, securing its position as the sixth-largest cryptocurrency by valuation.
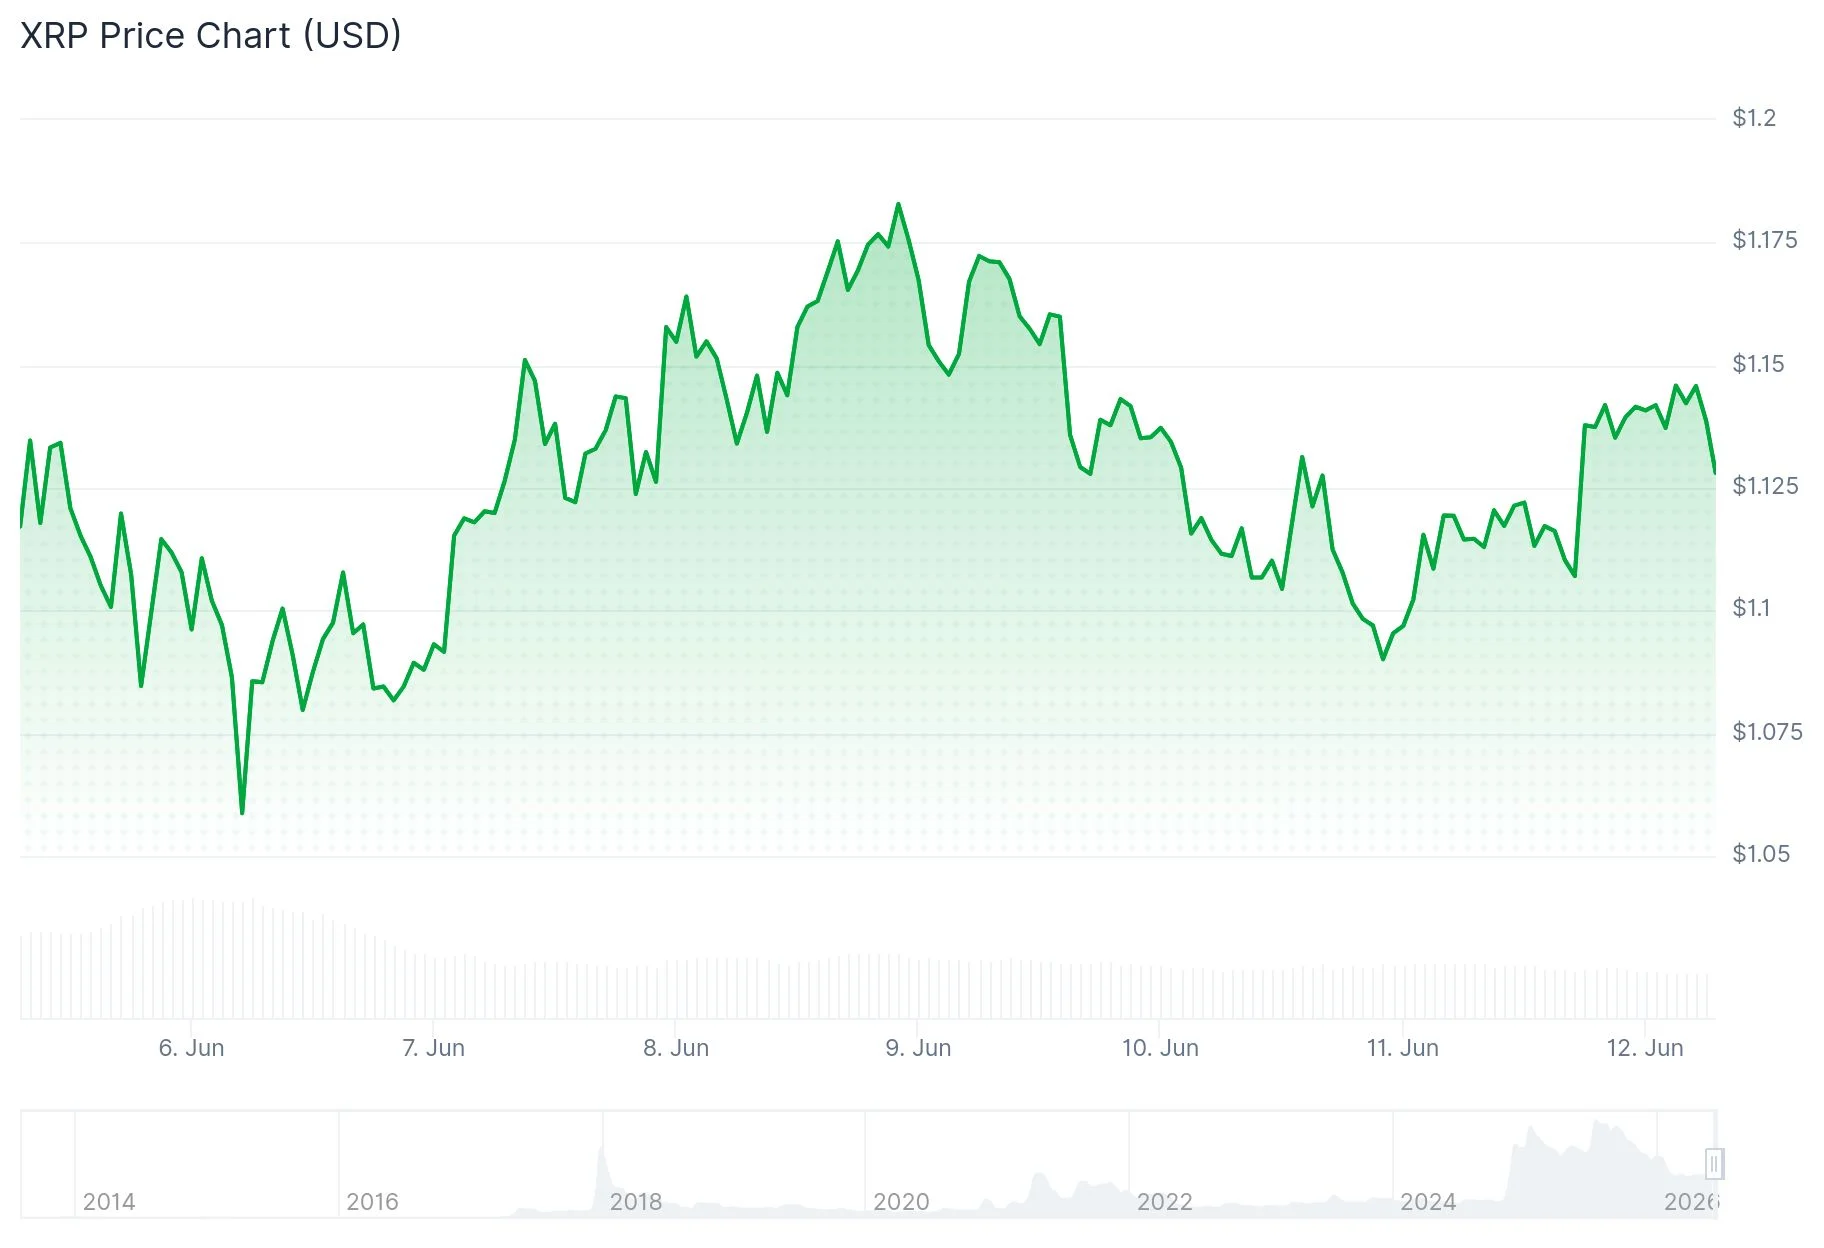
Market dynamics reveal that purchasing pressure successfully defended the $1.10 level after the previous week’s substantial selloff. This price point has emerged as a critical near-term foundation, positioned near the most recent breakdown level.
Cryptocurrency analyst Ali Charts shared insights on X, noting that the TD Sequential technical tool generated a buy indication on XRP’s 3-day timeframe. The analyst emphasized that historically, such higher-timeframe signals have preceded rebounds lasting one to four candlesticks, providing temporary respite following periods of market consolidation.
XRP momentarily climbed above $1.12 during evening trading hours accompanied by elevated volume. Throughout earlier sessions, the token fluctuated near $1.11 as accumulation efforts took shape.

Traders are closely monitoring the $1.12–$1.13 resistance band as the initial barrier. A decisive close beyond $1.13 supported by robust volume could pave the way toward $1.18, followed by $1.2380. Should XRP breach the $1.10 floor, subsequent downside targets include $1.09 and the lower Bollinger Band positioned near $1.04.
Elliott Wave Structure Suggests $2.39–$3.11 Objective
A technical analysis chart circulated on X by trader RWA_Investor outlines a potential three-wave corrective pattern developing from the recent bottom around $1.07. This projection illustrates Wave A advancing toward $1.94, succeeded by a Wave B retracement to approximately $1.46, culminating in a Wave C extension targeting the $2.39 to $3.11 corridor.
The anticipated Wave B pullback toward $1.46 should not be interpreted as bearish momentum, according to the technical framework. Rather, it represents a typical consolidation phase preceding the most powerful advancement stage.
A sustained breakout above $3.10 would indicate that XRP’s macro-level bottom has already formed near the $1.05 area. However, if the recovery effort falters beneath the upper projection band, market observers have identified a potential alternative downside scenario targeting the $0.75–$1.00 range.
Investment Product Flows Increase Despite Subdued Momentum
XRP-tracking investment vehicles registered $1.19 million in daily net inflows based on SoSoValue analytics, with cumulative net assets approaching $948.98 million. While the inflows represent a modest positive development, total assets remain below previous peak levels.
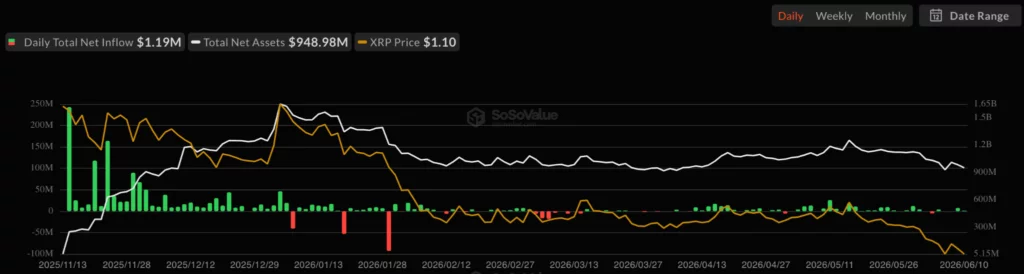
Open interest metrics remained near cyclical lows, indicating traders have yet to establish substantial directional commitments. Although trading volume shows signs of improvement, market participants appear focused on short-duration positions rather than sustained trend-following strategies.
The daily chart continues reflecting a downward trajectory from January peaks above $2.30. XRP underwent a consolidation phase between March and May before breaking lower throughout June. Bulls must recapture the middle Bollinger Band at $1.2380 to establish evidence of a more sustainable recovery pattern taking form.