
 Stock: Price Consolidation Hints at Potential Major Breakout Ahead")
Key Takeaways
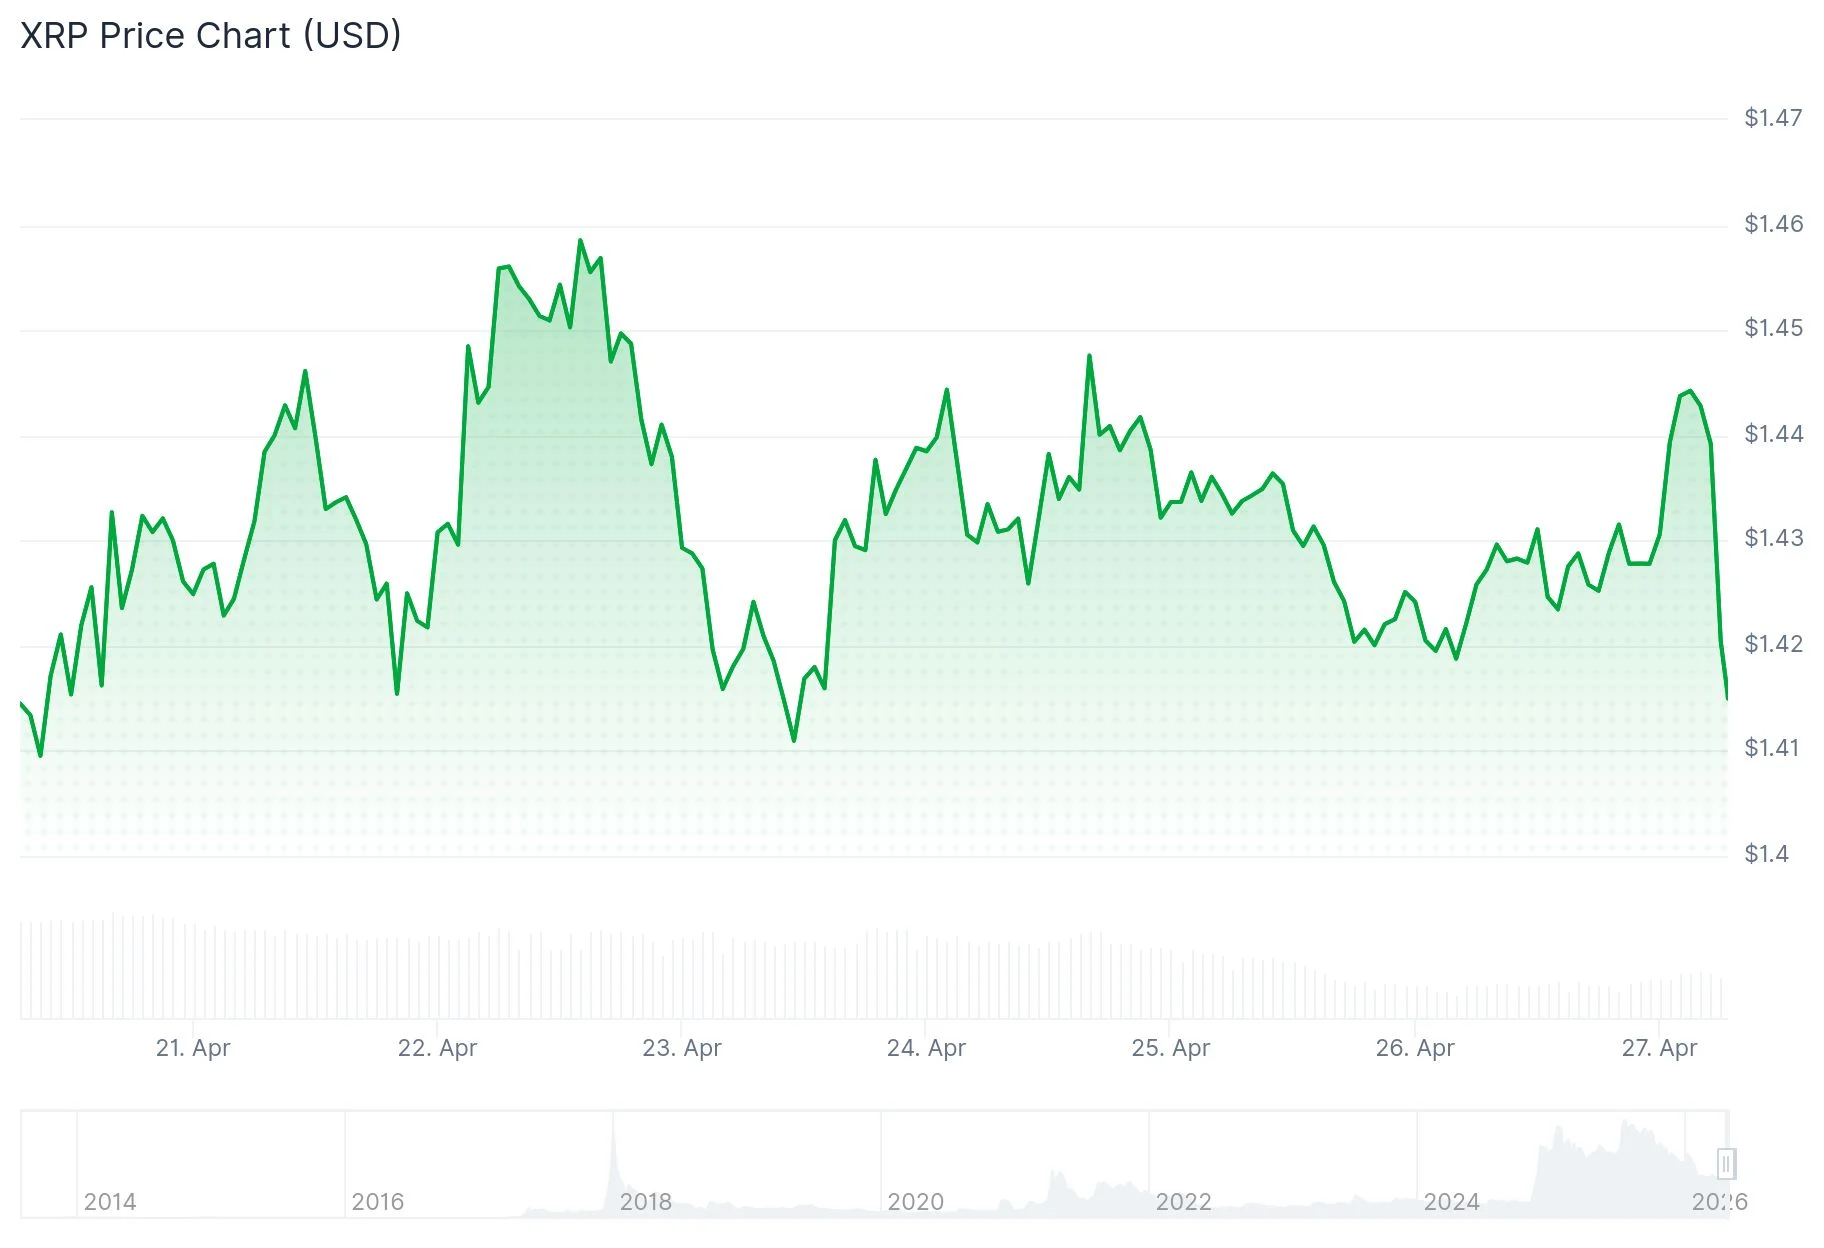
- XRP maintains a trading price of $1.42 alongside an $87.93 billion market capitalization and 24-hour trading volume of $1.09 billion
- Technical analysis reveals consolidation around 20-day and 50-day exponential moving averages in a compression formation
- Relative Strength Index hovers between 54–55, indicating neutral momentum with slight bullish undertones
- Penetration above the $1.45–$1.50 resistance zone may trigger a move toward $3.00
- Breakdown beneath $1.10 support level risks a decline toward $0.90
XRP maintains its position at $1.42, demonstrating remarkable stability throughout the recent trading week with minimal directional volatility. The digital asset recorded $1.09 billion in trading activity during the past 24 hours, representing approximately a 4% decline.
With its market valuation holding firm at $87.93 billion, the cryptocurrency exhibits characteristics consistent with consolidation rather than significant buying or selling momentum.
Market analyst EGRAG CRYPTO observed a notable shift in trader behavior, with participants transitioning from traditional candlestick analysis to line chart evaluation. This methodology effectively eliminates short-term volatility noise, providing enhanced visibility into broader market trajectories.
EGRAG CRYPTO’s analysis identifies a developing compression formation within XRP’s price structure — characterized by descending peaks converging toward an established support boundary. Such technical configurations frequently precede re-accumulation phases before substantial directional movements.

The monthly chart reveals the 50 EMA functioning as current support. EGRAG CRYPTO additionally highlighted the potential for a brief downward wick approaching the 100 EMA before any expansionary price action materializes.
Near-Term Technical Analysis
Examining the hourly timeframe, XRP advanced to $1.4471 before experiencing a modest retracement. The asset continues trading above its 100-hour Simple Moving Average and maintains position above a bullish trendline offering support around $1.4320.
Near-term exponential moving averages — spanning the 10, 20, 30, and 50 periods — all position below current price action while generating buy signals. This configuration indicates market participants are actively purchasing during temporary pullbacks.
The primary resistance barrier establishes itself at $1.45. Successful penetration above this threshold could facilitate upward progression toward $1.4650, subsequently $1.4840, and potentially $1.50. Beyond this range, $1.5150 represents the next significant obstacle.
Regarding downside protection, preliminary support materializes at $1.44, followed by $1.4320. A decisive close beneath $1.4320 would likely activate $1.4050 and $1.40 as subsequent support levels.
Technical Momentum and Critical Price Points
The Relative Strength Index registers near the 54–55 range, positioned above equilibrium following its recovery from oversold territory observed in February. The MACD indicator has generated a tentative buy signal, though market analysts emphasize it lacks sufficient strength to validate an imminent breakout.
Additional momentum indicators including the stochastic RSI and commodity channel index occupy neutral zones. This collective equilibrium across technical tools suggests a market environment awaiting a catalytic event.
The primary pivot point anchors near $1.41. Overhead resistance emerges at $1.51, with extended resistance targets positioned at $1.72 and $2.04. Downside support initiates at $1.22, with deeper protective levels located at $1.10 and $0.90.
XRP currently maintains position marginally above the $1.41–$1.43 pivot range, which technical analysts identify as the decisive zone that will determine the asset’s subsequent directional trajectory.