
 Stock: Price Action Tests Critical $1.40 Threshold as Bulls Take Control")
Key Highlights
- XRP surged after successfully breaching a downward trend line on shorter timeframes.
- The digital asset peaked at $1.3963 before experiencing minor consolidation while maintaining position above the 100-hour SMA.
- Market participants are closely monitoring the $1.3880-$1.40 resistance band for potential breakthrough.
- Downside protection remains established around $1.3575 and $1.3330 should bullish momentum fade.
- Broader cryptocurrency developments included positive ETF flows and regulatory advancement, though technical indicators show divergence.
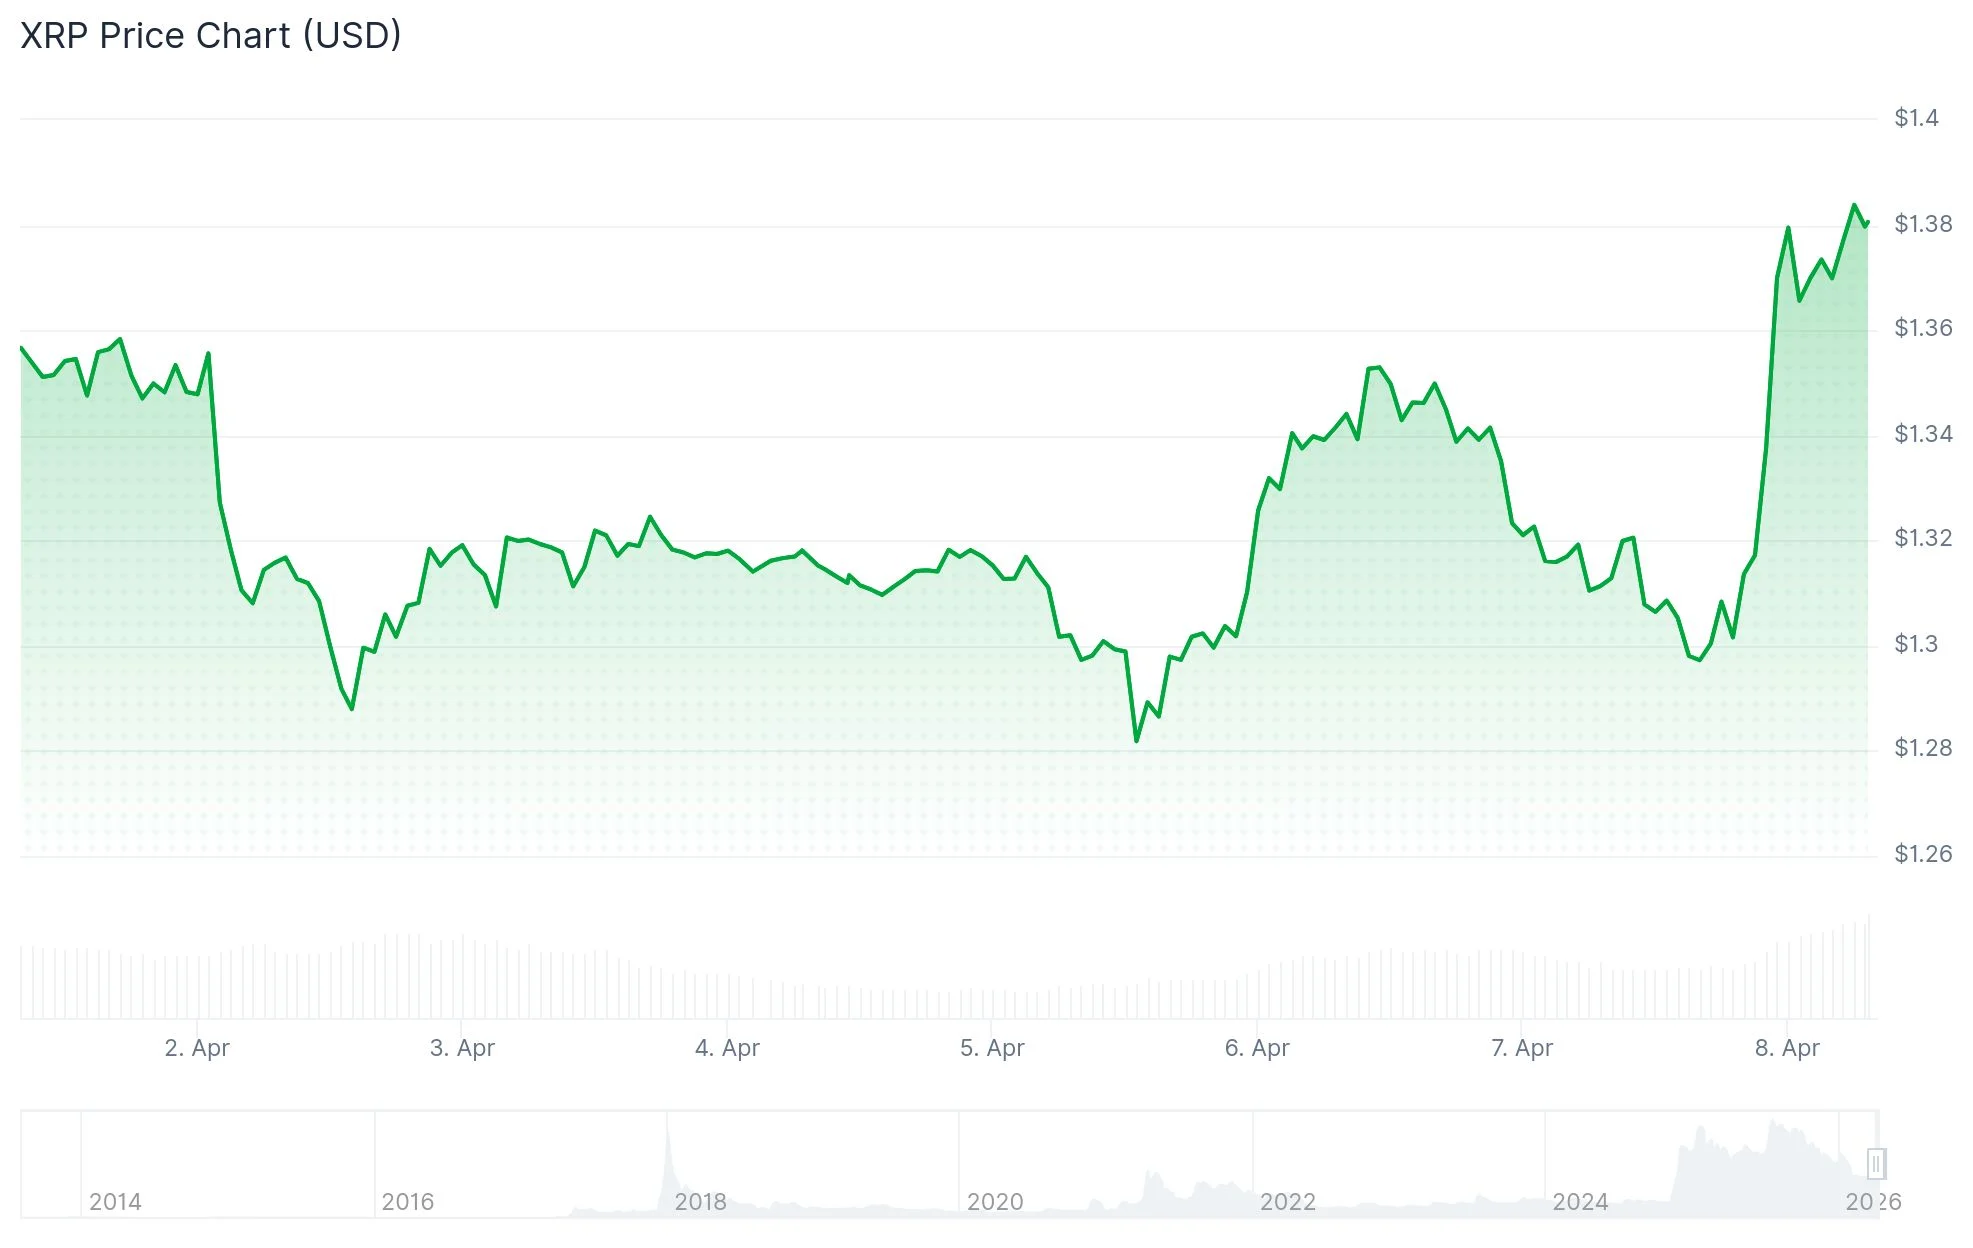
XRP (XRP) extended gains and challenged the $1.40 threshold during the latest trading session. The cryptocurrency hovered around $1.38 following its intraday peak of $1.3963.
The upward trajectory initiated once XRP penetrated through the $1.350 and $1.3550 price points. Momentum continued as buyers drove price action beyond the $1.3650 barrier.
Technical analysis of the hourly timeframe revealed XRP’s breakout above a descending trend line positioned around $1.3350. This technical development provided additional fuel for the ongoing advance.
Following the session high of $1.3963, XRP underwent modest profit-taking. Nevertheless, the price maintained its position above $1.3550 and the 100-hour simple moving average.

This structure keeps focus firmly on nearby obstacles. Market watchers are now assessing whether XRP can overcome $1.3880 before tackling $1.40.
Key Resistance Levels Draw Attention
Should XRP successfully breach $1.40, subsequent resistance targets emerge at $1.4250 and $1.4450. Additional overhead challenges appear near $1.4650.
Near-term technical structure indicates buyers maintain the upper hand currently. The cryptocurrency continues trading above its primary moving average following the recent rally.
Separate market analysis indicated XRP posted a 5.63% daily gain, reaching approximately $1.3848. The assessment noted XRP trading above its 20-day moving average while remaining beneath both 50-day and 200-day averages.
The analysis also highlighted the Ichimoku Kijun positioned near $1.4429. This technical marker sits above current prices, contributing to the resistance cluster overhead.
Critical Support Zones in Play
Should XRP encounter rejection at the $1.3880 resistance barrier, downside pressure could emerge. Initial support appears near $1.3575.
Beneath that threshold, the subsequent major support zone lies near $1.3330. This level coincides with the 61.8% Fibonacci retracement spanning the recent move from $1.2940 through $1.3963.
Failure to hold $1.3330 would bring $1.3080 and $1.3020 into focus. Deeper support beyond those areas materializes near $1.2750.
Additional market commentary noted XRP has consolidated within a narrow $1.37-$1.39 corridor despite robust institutional capital flows. The report highlighted US spot XRP ETFs accumulating over $1 billion since inception, with $224 million entering during the most recent week.
Technical momentum indicators presented conflicting signals, with the RSI suggesting bullish tendencies while the Stoch RSI registered overbought territory. Market analyst Anton Kharitonov expressed caution, maintaining a defensive stance until XRP achieves a decisive break above $1.39.
Finance Bull highlighted XRP’s breakout coinciding with the two-week ceasefire agreement and Strait of Hormuz reopening, projecting potential for sustained upward price action. While the commentary carried optimistic sentiment, it lacked specific chart-based projections or quantified price objectives.
Presently, the most relevant technical scenario remains evident: XRP is testing the $1.3880-$1.40 resistance complex following its advance from $1.2940.