
 Stock: Plunges 68% From Peak — Could the Bottom Be Near?")
Key Takeaways
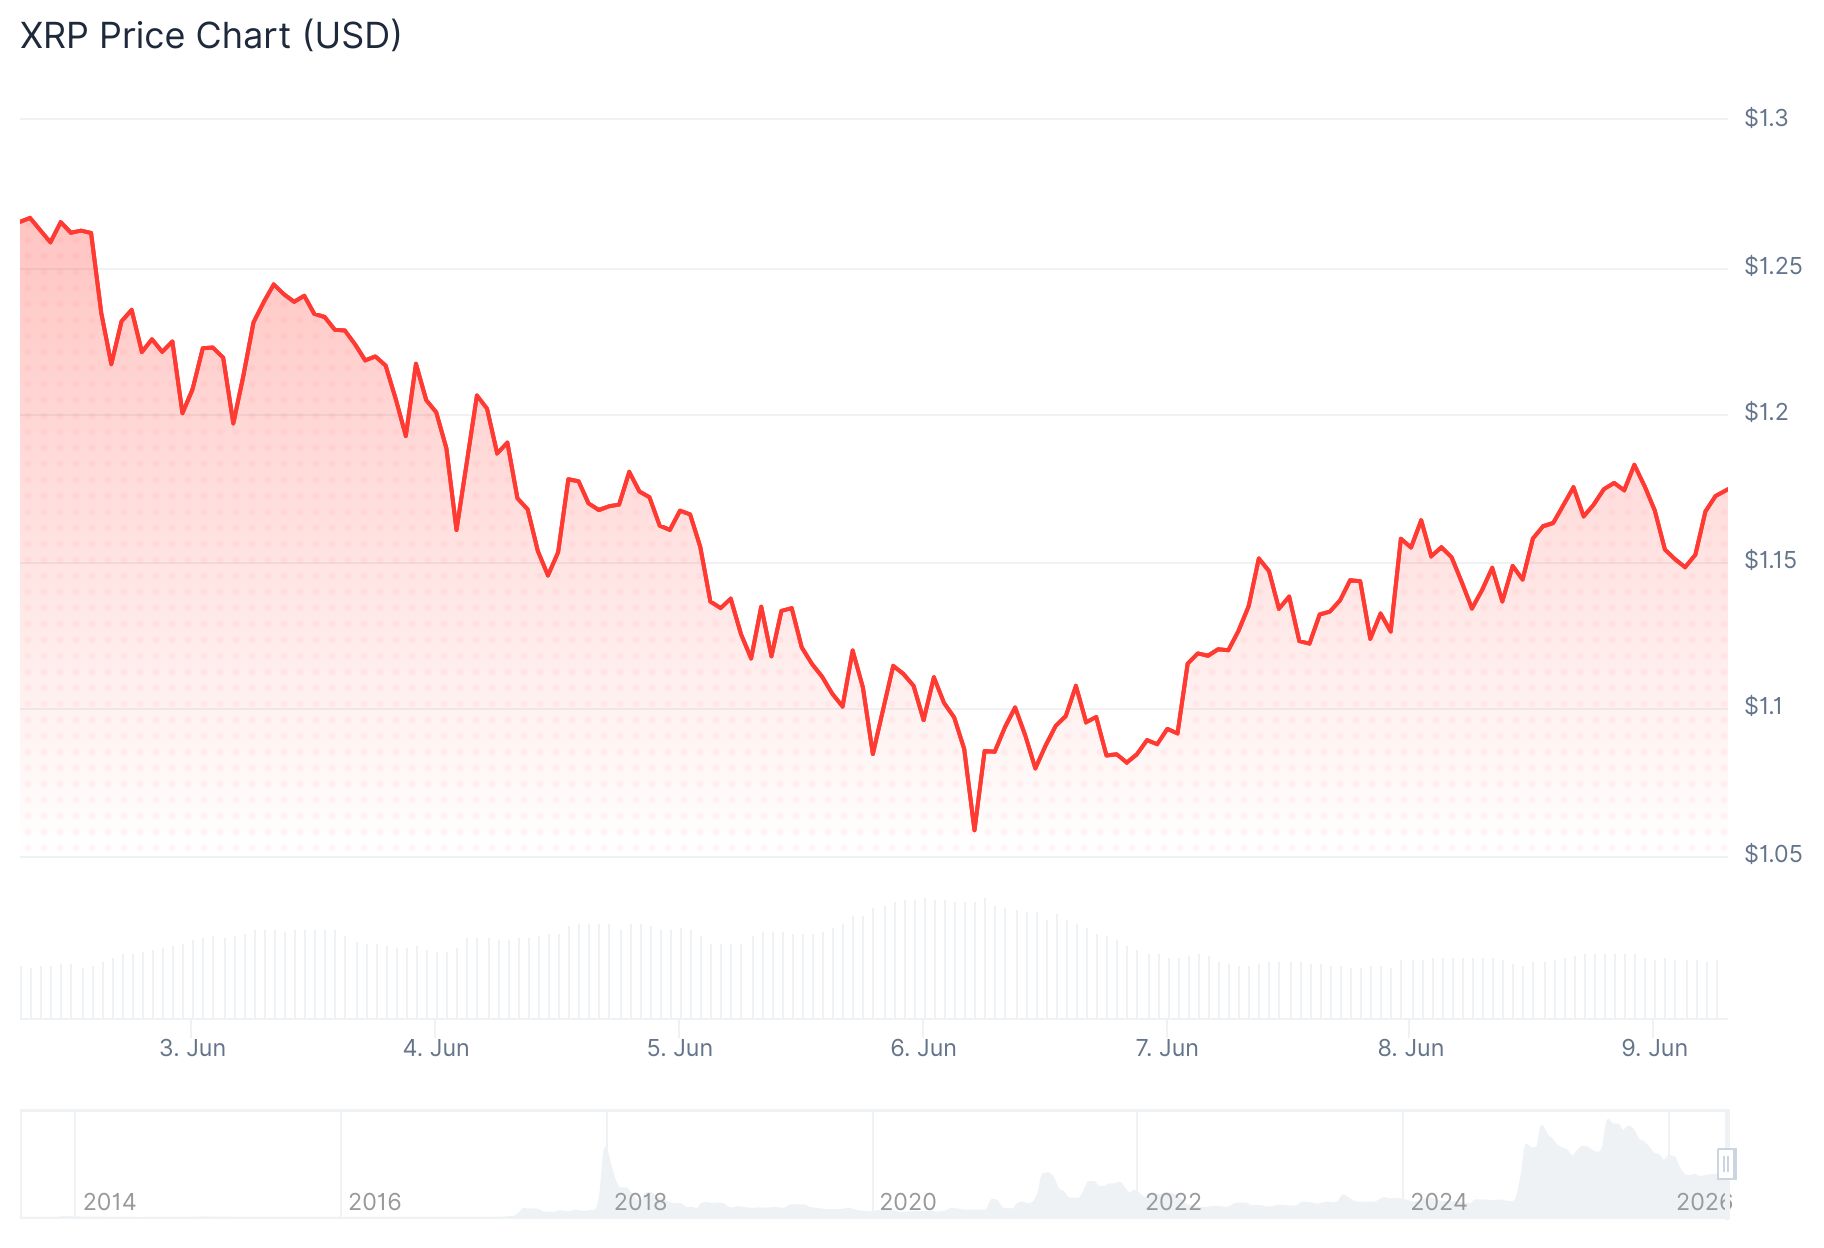
- XRP has crashed 68.5% from its $3.65 peak in July 2025, currently hovering around $1.14
- Previous support at $1.27 has been breached and transformed into a resistance barrier
- Crypto analyst Ali Martinez identifies $0.90 as a critical level for potential long-term entry
- Blockchain metrics present conflicting narratives: whale holdings surge while tokenized asset activity plummets 59%
- Multiple technical signals, including RSI under 31 and a descending weekly pattern, indicate further declines may occur
XRP has plummeted to approximately $1.14, marking its weakest price point in nearly 19 months. This represents a devastating 68.5% collapse from the token’s all-time peak of $3.65 achieved in July 2025.
The selling pressure has intensified in recent periods. The digital asset has surrendered 11.8% of its value over the previous seven days and shed nearly 18.9% throughout the past month.
Market participants are now fixating on the $1 threshold. This psychologically significant level represents the next major support area should the current price floor fail to hold.
XRP’s volatility is well-documented. Throughout the preceding five years, the asset has experienced four distinct corrections exceeding 40% within six-month timeframes. The present 46% half-year decline aligns with this established pattern.

Technical analyst ChartNerd, whose Gaussian Channel methodology successfully pinpointed the last three market bottoms, observes that XRP bear cycles have historically persisted between 400 and 790 days with retracements ranging from 85% to 96%. The current downturn has lasted approximately 350 days with a 71% decline from July 2025’s summit. His analysis suggests the cycle trough lies between $0.70 and $0.90, potentially materializing before this year concludes.
Chart Analysis Suggests Additional Weakness
XRP has decisively broken through $1.27, converting what was formerly a support floor into an overhead resistance ceiling. A modest bounce to $1.14 occurred alongside a 44% contraction in trading volume, which market analysts typically interpret as insufficient buying momentum.
The 14-period RSI has descended below 31, placing XRP firmly in oversold conditions. The weekly MACD continues trading beneath the zero line. The Aroon Down metric registers 85.71% compared to an Aroon Up reading of merely 35.71%, demonstrating sustained bearish dominance.
The 200-day exponential moving average rests at $1.6179, representing a substantial barrier above current levels. Should XRP close below $1.10 on a daily basis, the path toward $1.09 becomes likely, and a violation of that threshold would expose sub-dollar territory.
Prominent cryptocurrency analyst Ali Martinez has highlighted $0.90 as his primary level of interest. His June 7 statement declared: “If price gets there, I think it could offer a compelling long-term buying opportunity.” Martinez’s observation reflects increasing analytical focus on the $0.90 to $1.00 band as a potential zone for strategic accumulation.
Blockchain Metrics Show Conflicting Trends
Despite the bearish price action, certain indicators suggest underlying strength. Exchange balances decreased by over 25 million XRP in recent activity, a pattern frequently associated with investor accumulation. Binance deposit volumes reached their 2026 nadir this week. Addresses classified as whale wallets climbed to an unprecedented 332,230.
Conversely, fundamental metrics for the XRP Ledger reveal deterioration. Transfer volume for tokenized assets on XRPL contracted 59% across 30 days to $54.1 million. The aggregate value of tokenized assets on XRPL declined 11% to $384.5 million. XRPL currently commands slightly over 1% of the tokenized asset sector.
Meanwhile, stablecoin transfer activity on XRPL surged 118% to $4.5 billion, while the count of real-world asset holders on the network expanded 275% to 105 participants.
The upcoming significant macroeconomic catalyst arrives with US CPI data scheduled for release on June 10, 2026.