
 Stock: Market Flush Sets Stage for Potential Rally to $1.30 Resistance")
Key Highlights
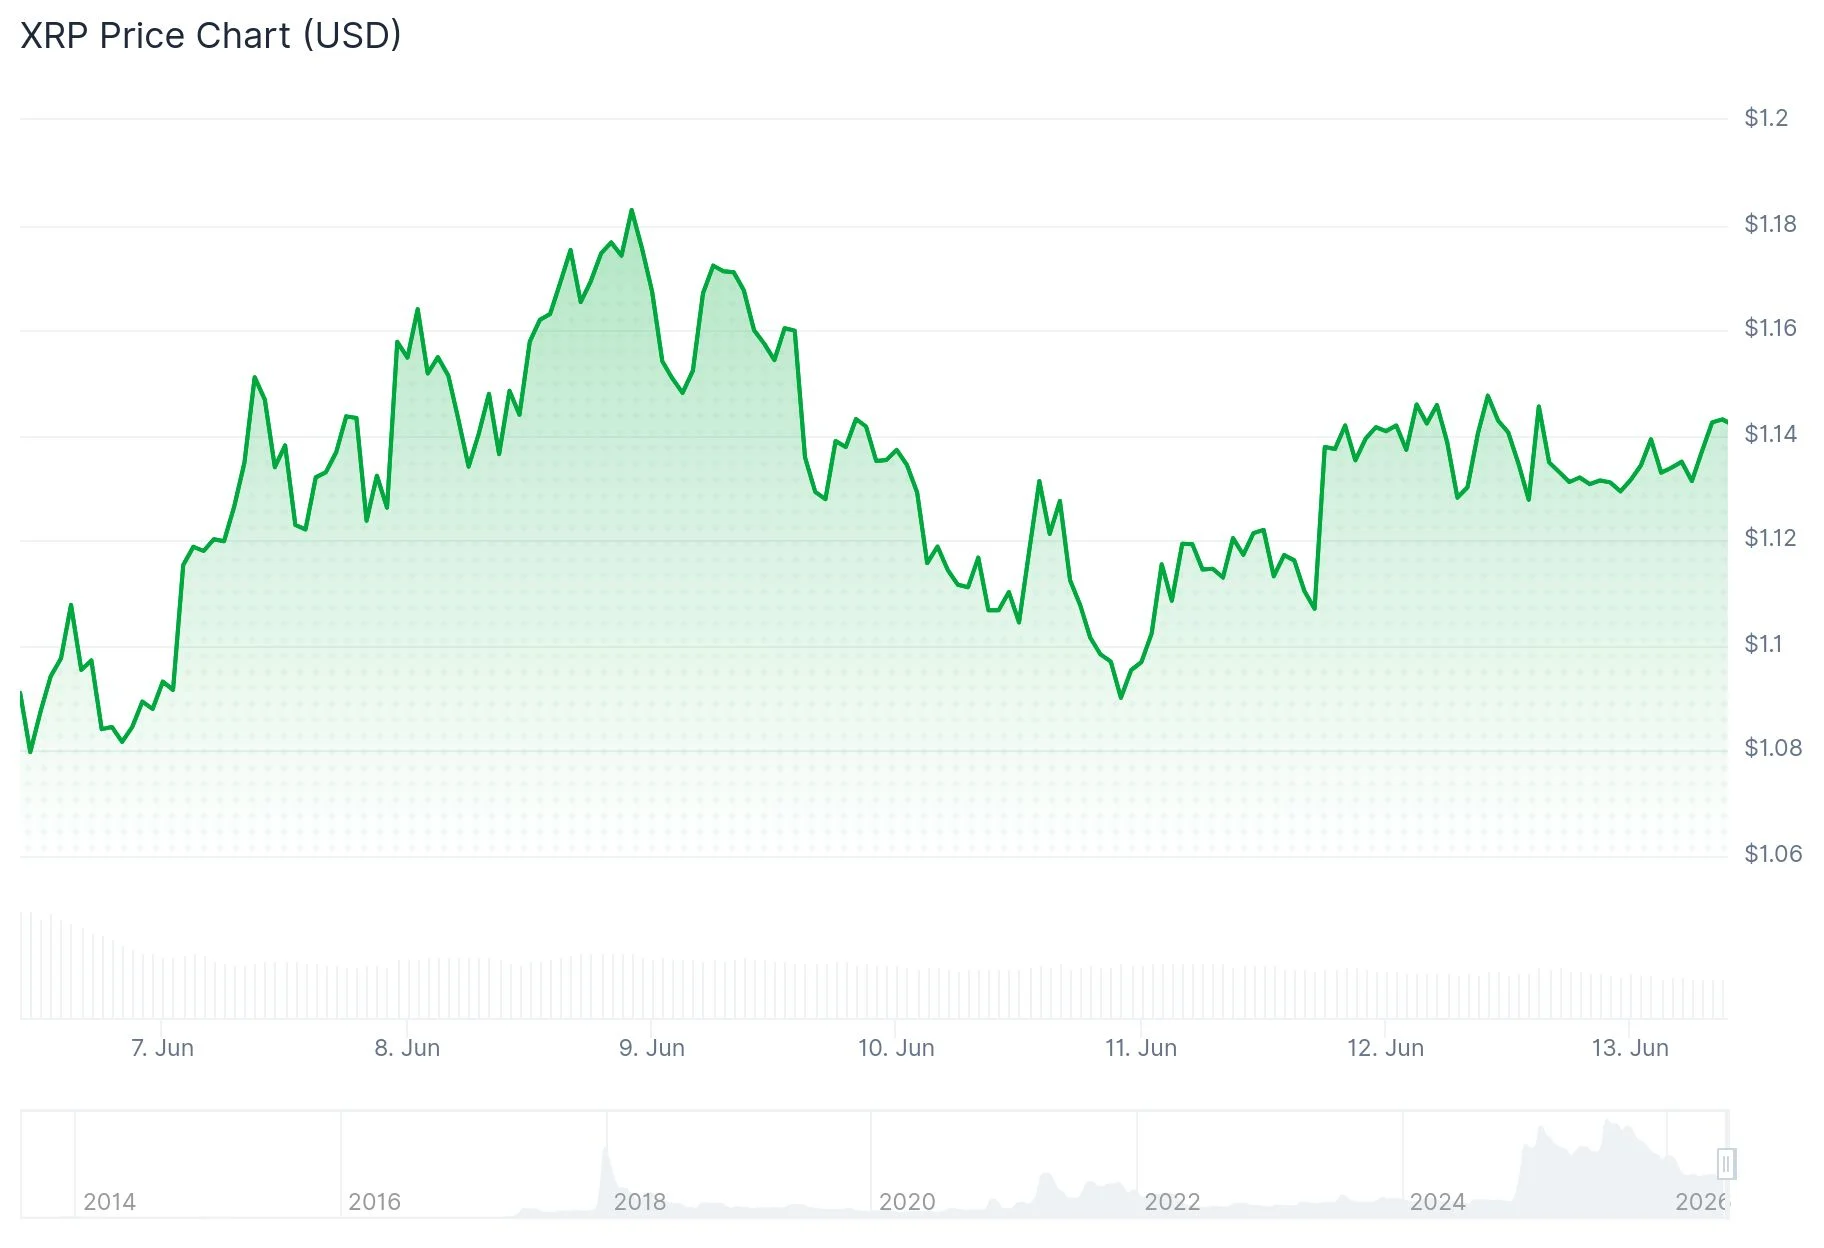
- XRP maintains position above $1.14 following a temporary decline to $1.05 during the latest market downturn
- Technical indicators reveal a bullish RSI divergence pattern, with market watchers focusing on the $1.30 price level
- Derivatives market shows cooling activity with Futures Open Interest declining from $2.96 billion in early June to $2.45 billion
- ETF activity shows inconsistent patterns, recording no flows on Thursday while total cumulative inflows reach $1.43 billion
- Price action remains constrained below critical moving averages, with the 50-day EMA positioned near $1.30 as significant overhead resistance
The digital asset XRP from Ripple is currently hovering near $1.14 following a rebound from its June bottom at $1.05. This downward movement cleared out stop-loss orders and eliminated overleveraged positions before market participants re-entered.
CryptoPulse, a market technician, characterized this price action as a “capitulation flush,” noting that breaching the $1.13 support area was essential for establishing a foundation before any upward momentum could develop.
The subsequent bounce has highlighted an emerging technical formation on the Relative Strength Index. Despite price establishing a fresh lower low, RSI printed a higher low — creating a bullish divergence pattern that indicates weakening downside momentum.
Cooling Activity in Derivatives and Exchange-Traded Products
Open Interest in XRP futures contracts stood at an average of $2.96 billion at the start of June but has contracted to $2.45 billion currently. This reduction signals diminishing appetite for establishing new leveraged positions, reflecting cautious sentiment regarding immediate price appreciation.

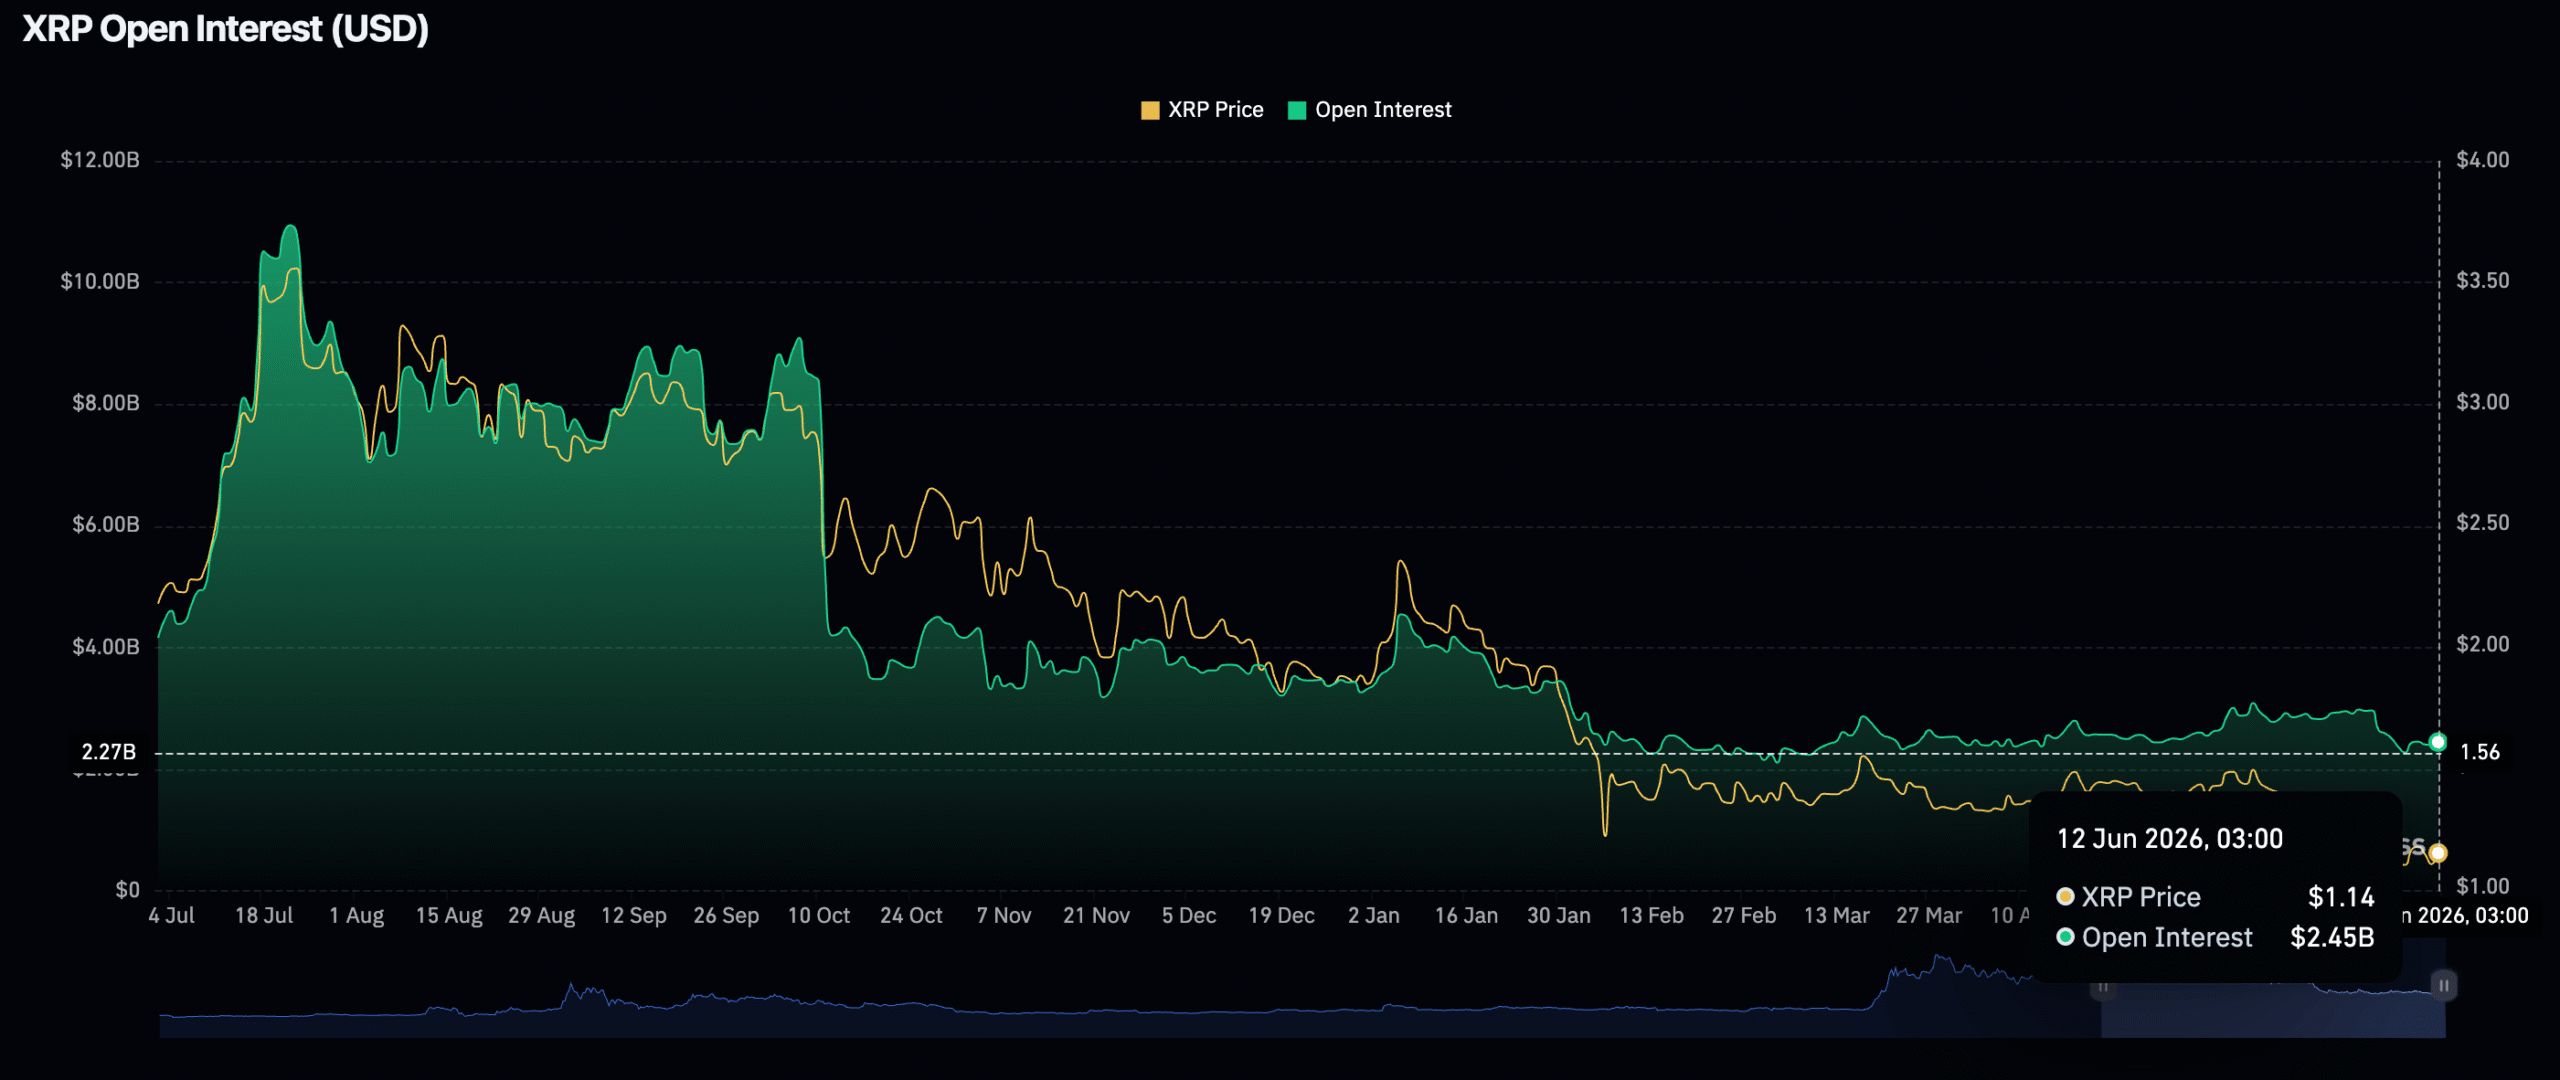
Flow data for XRP spot exchange-traded funds has demonstrated volatility. Tuesday witnessed $7.44 million in fresh capital, followed by $1.2 million on Wednesday, before Thursday registered absolutely no movement. Total ETF inflows have accumulated to $1.43 billion, while assets under management currently sit at $985 million.
Technical analyst ChartNerd identified a notable pattern on the bi-weekly timeframe. The token has retreated to the lower regression band of the Gaussian Channel at $1.04, a technical zone that has historically marked significant turning points. ChartNerd labeled this area as “the land of macro opportunity” and noted this cyclical pattern has demonstrated consistency across previous market phases.
Critical Moving Averages Present Overhead Challenges
XRP continues to trade beneath its 10-day, 50-day, 100-day, and 200-day exponential moving averages. The 50-day EMA hovers around $1.30, converging with the primary resistance zone under analyst scrutiny.
The 100-day EMA positions itself near $1.39, with the 200-day EMA located around $1.61. These technical levels establish a substantial resistance corridor that must be penetrated for any durable upward trend.
The 14-period RSI currently registers 35.10, approaching but not yet reaching oversold conditions. The MACD indicator shows a marginally negative reading at -0.06656. Meanwhile, the 10-period Momentum oscillator has generated a Buy signal, potentially indicating diminishing selling pressure in the near term.
According to TradingView metrics, the aggregate technical assessment shows a Neutral rating, comprised of 14 Sell indicators, 10 Neutral readings, and only 2 Buy signals.
An Elliott Wave interpretation suggests XRP may be finalizing a Wave (2) corrective phase within a broader Cycle Wave V formation. The proposed accumulation range spans between the 50% and 61.8% Fibonacci retracement levels, approximately $1.19 to $0.91. Technical strategists assign a 65-70% probability to the continuation of the larger bullish framework.
At the time of publication, XRP was exchanging hands near $1.14, representing a 24-hour gain of 3.06%.