
 Stock: Market Fear Returns While Whales Make Strategic Moves")
Key Takeaways
- Major XRP holders removed 122 million tokens (approximately $170.8M) from Binance on May 22, marking the biggest single-day withdrawal since February.
- Market participants are closely monitoring the $1.35–$1.40 price zone as a potential accumulation area, where significant withdrawals have occurred repeatedly.
- Spot XRP ETFs in the United States have maintained positive capital flows for 16 straight trading sessions, accumulating $116.75 million in total inflows.
- Technical analyst ChartNerd cautions that breaking below the $1.30 level could trigger a decline toward the lower $1 range.
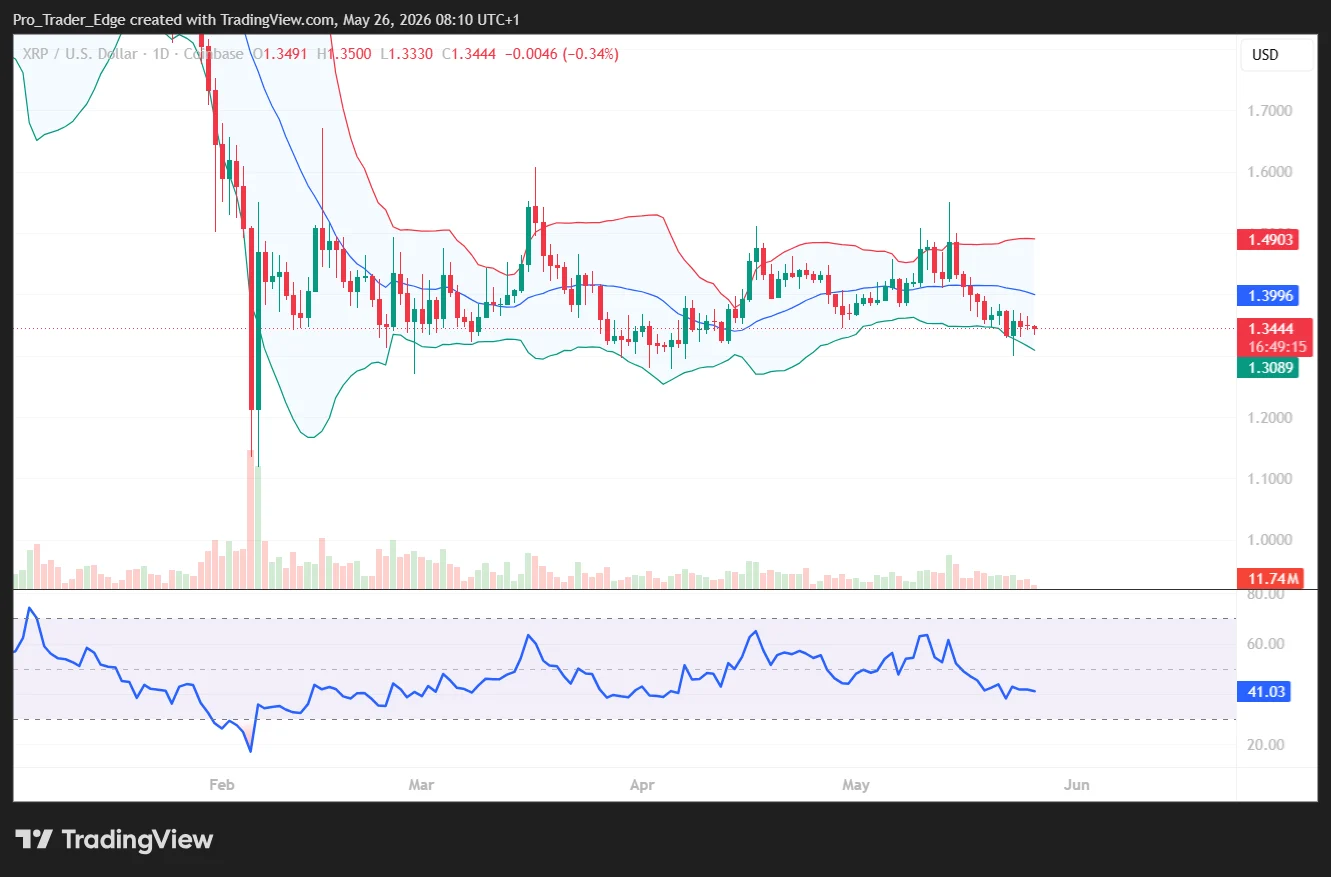
- Technical indicators show Bollinger Bands reaching their narrowest point since mid-2024, a pattern that historically preceded price movements between 58% and 82%.
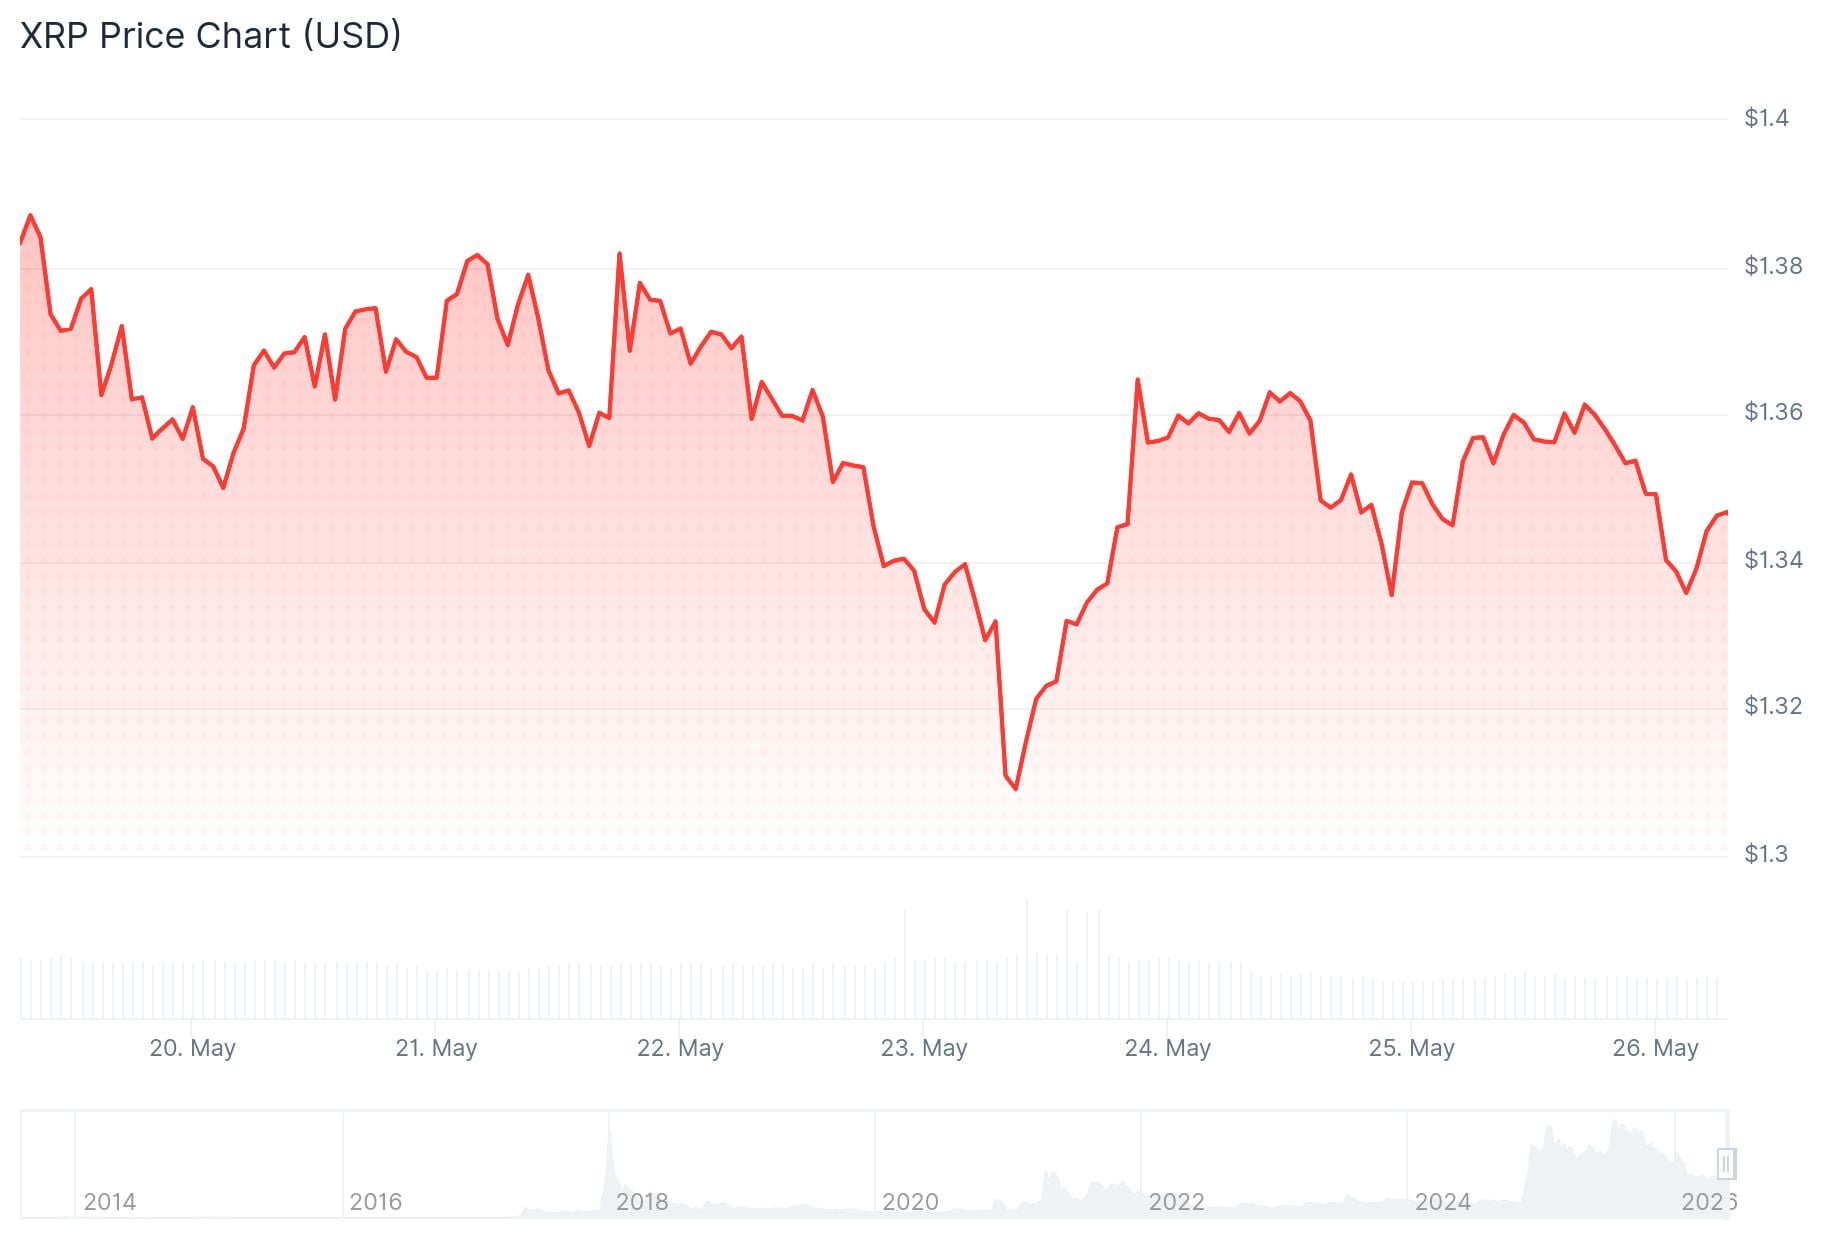
XRP currently hovers around the $1.35 mark as significant whale movements and sustained ETF demand capture market attention.
Blockchain analytics data from CryptoQuant revealed that on May 22, a massive transfer of 122 million XRP tokens—valued at approximately $170.8 million—left Binance exchange. This represents the most substantial daily outflow exceeding 100 million XRP since early February, when 278 million tokens were withdrawn.
CryptoQuant’s analyst Amr Taha highlighted an interesting pattern: the February withdrawal spike occurred when XRP traded around $1.43, while this recent massive outflow happened near $1.35. According to Taha, the consistency of large withdrawals occurring at similar price points could indicate that institutional players and whales view this range as an attractive entry zone.
Concurrently, XRP’s net exchange position change dropped to -$30 million on the same date—the most negative figure recorded since April 9, when the token traded near $1.28. Following that April low, XRP experienced a 17% surge, climbing to $1.51 by April 17.

Institutional Demand Through ETFs Continues Building
The United States spot XRP exchange-traded funds have maintained an impressive streak of 16 consecutive days with positive net inflows, accumulating a combined $116.75 million throughout this period. This consistent institutional buying pressure from American investors represents an important supporting factor for the asset.
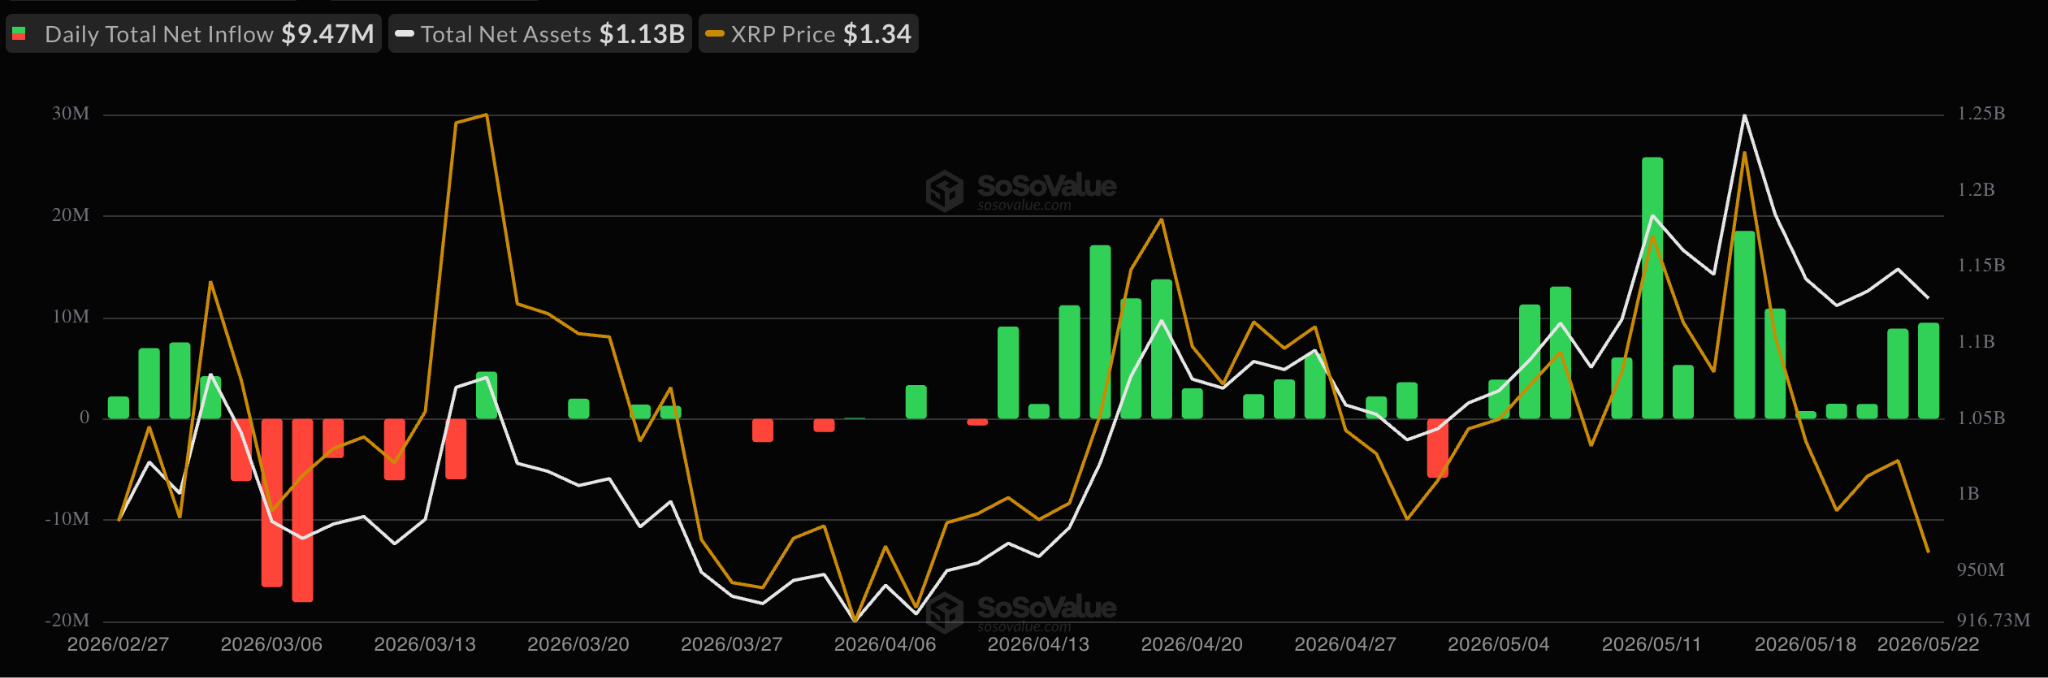
The combination of tokens leaving exchanges and steady ETF capital inflows suggests a reduction in available selling pressure and tightening market liquidity.
Meanwhile, sentiment tracking from Santiment reveals that crowd psychology around XRP has shifted bearish once again, with only 1.1 positive comments for every negative one. According to Santiment’s analysis, this type of widespread fear and doubt has historically served as a contrarian indicator, with previous drops into their designated “FUD zone” typically preceding price stabilization or upward reversals.
Since early February, XRP has been consolidating within a defined range of $1.30 to $1.50. Market analyst ChartNerd identifies $1.30 as a critical “guardrail” level, suggesting that a confirmed break below this threshold could result in further downside toward the lower portion of the $1 range.
Chart Patterns Point Toward Significant Volatility Ahead
From a technical analysis perspective, XRP’s Bollinger Bands have contracted to their narrowest configuration since the middle of 2024. Historical data shows that similar periods of extreme compression have typically been followed by substantial price movements ranging from 58% to 82%, which would project a potential upside target around $2.33.
Crypto analyst Patel drew parallels between the current consolidation phase and the period preceding XRP’s significant breakout in late 2024, establishing an ambitious long-term price target of $10.
As of May 26, XRP trades beneath $1.3580 and remains below its 100-hour simple moving average. Immediate resistance levels are positioned at $1.360, with subsequent barriers at $1.3720 and $1.380. On the support side, key levels to watch include $1.330, $1.3280, and the critical $1.30 threshold.