
 Stock: 190M Tokens Bought by Whales as Technical Indicators Point to Cycle Low")
Key Takeaways
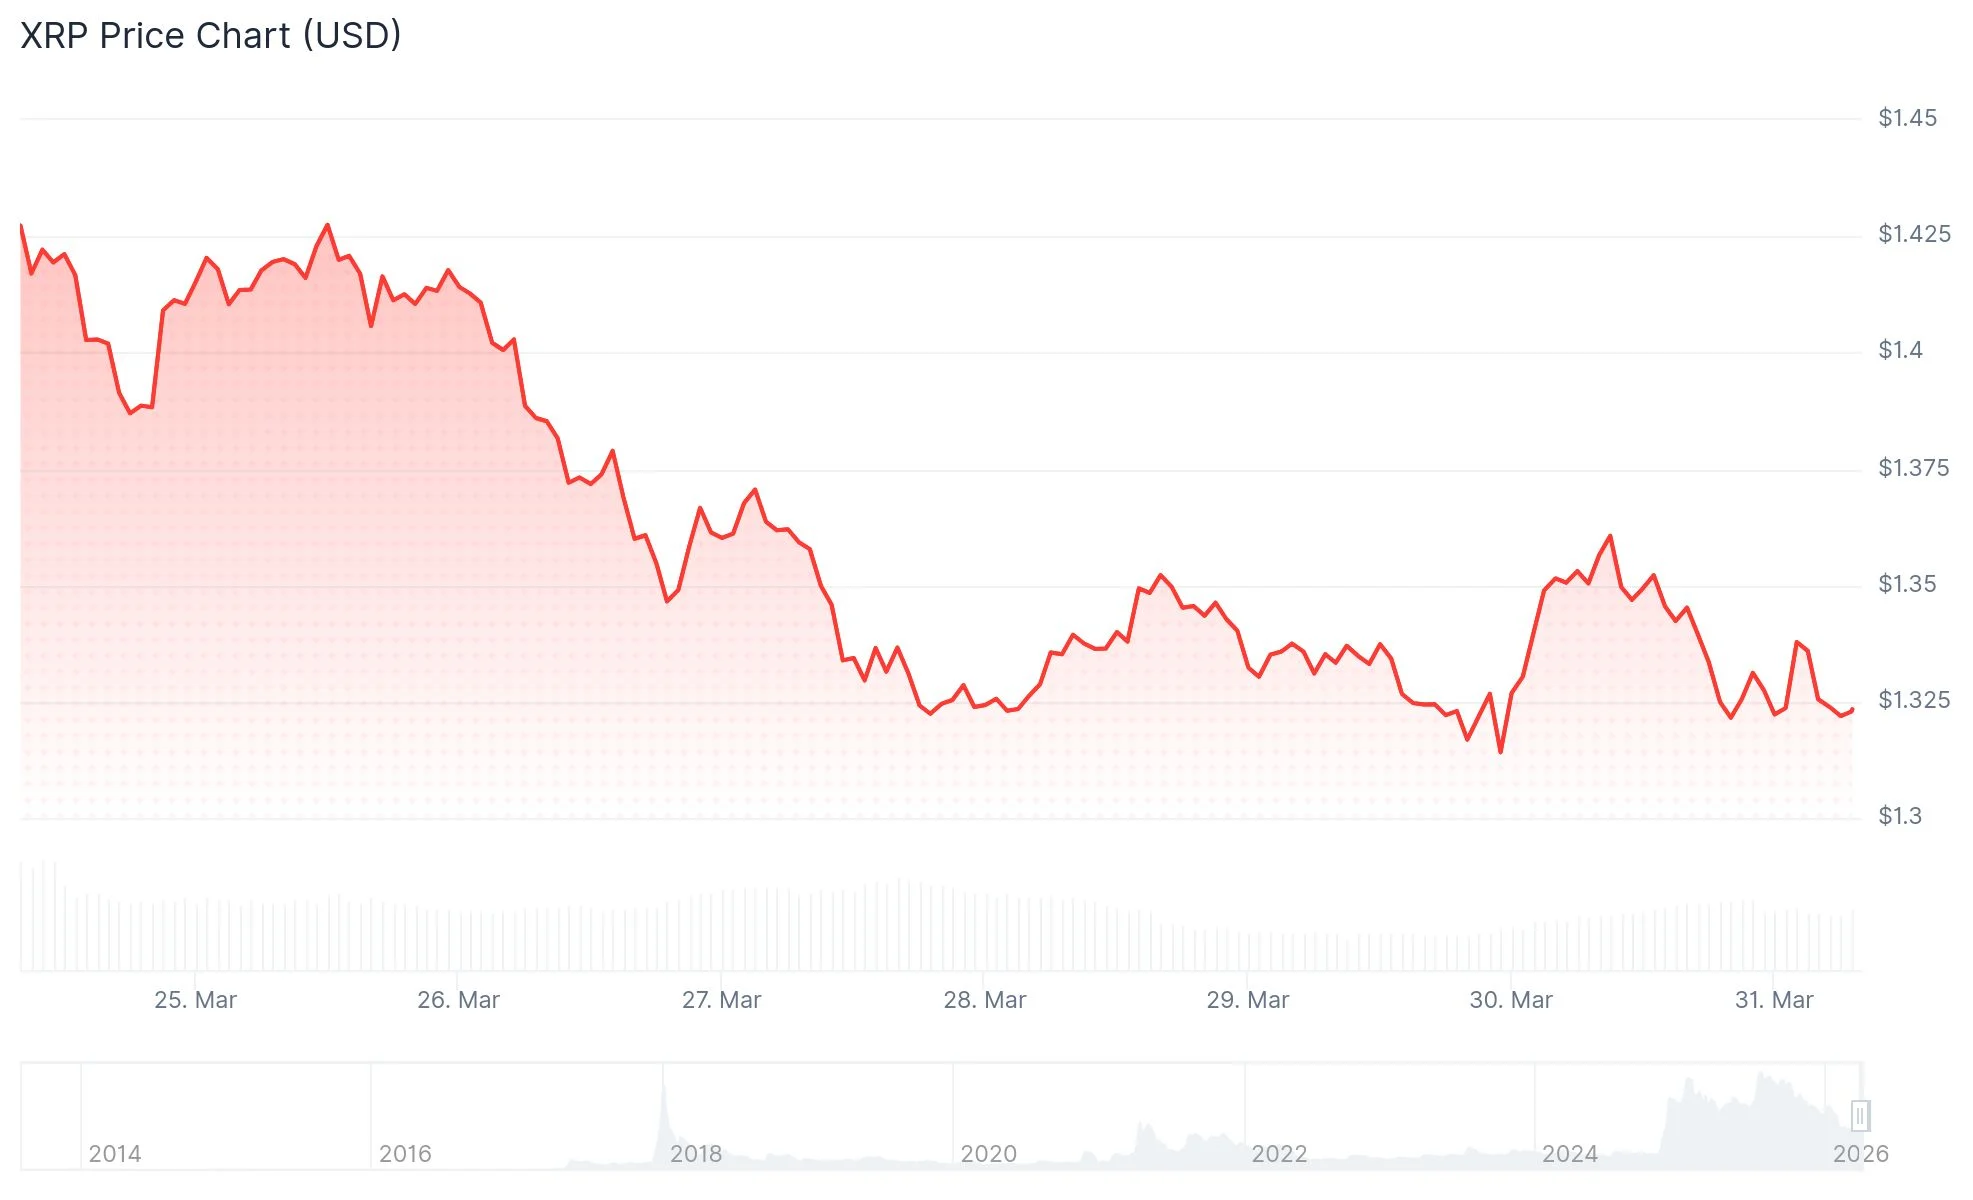
- XRP currently hovers between $1.32 and $1.35 while multiple technical signals point toward a potential cycle low
- Weekly RSI reached an oversold reading of 29 on March 2 and has since rebounded to 34
- MACD indicator sits at historically low levels and approaches a bullish crossover pattern
- Approximately 500 million XRP tokens were purchased near the $1.30 price point, establishing it as crucial support
- A breakdown through the $1.27–$1.30 range would expose support at $1.15–$1.12, with downside risk extending to $0.80
Following an eight-month bearish trajectory, XRP appears to be exhibiting technical characteristics that have previously coincided with significant market bottoms.
The digital asset currently fluctuates within the $1.32 to $1.35 range, with market participants closely monitoring whether buyers can maintain control above the critical $1.30 threshold.
On March 2, the weekly Relative Strength Index plunged to 29, entering deeply oversold conditions. Since that low, the indicator has climbed back to 34. Past instances when XRP’s RSI reached comparable depths have typically preceded substantial upward price movements.
Simultaneously, the MACD (Moving Average Convergence Divergence) has descended to unprecedented lows for this cryptocurrency. The indicator now appears poised to generate a bullish crossover—a technical development that has historically coincided with major turning points in XRP’s price trajectory.

When these two technical factors—an oversold RSI combined with a bullish MACD crossover—have converged in previous cycles, XRP experienced rallies ranging from 74% to as high as 230%. These patterns materialized notably in 2022 and again during the middle of 2024.
Critical Support Zone at $1.30
Market analyst Egrag Crypto characterized the $1.30 region as “a very sensitive level” that represents a pivotal juncture where “the market chooses direction.” According to his assessment, sustained defense of this zone could facilitate gradual upward momentum, while failure to hold may trigger a retest of $1.15.
Blockchain analytics from Glassnode reveal that close to 500 million XRP tokens changed hands near the $1.30 price point. This substantial accumulation creates a dense cluster of cost basis, forming a robust foundation of buyer interest.
Should the $1.30 level fail, attention shifts to the next support band spanning $1.15 to $1.12, which aligns with the 200-week simple moving average. A violation of this deeper support would activate the bear flag projection targeting $0.80.
Analyst Arthur highlighted on X that the weekly RSI for XRP had declined to one of its most depressed readings in recent years, questioning whether the chart was “flashing a long-term bottom signal.” Fellow analyst Cryptoinsightuk observed that this marks only the second time XRP has registered oversold conditions on this timeframe, with the previous occurrence in July 2022 precisely marking a major low.
XRP Performance Against Bitcoin
Relative to Bitcoin, XRP has begun showing signs of stabilization near the lower boundary of an extended consolidation pattern. The previous time XRP formed a base against BTC at this level occurred in June 2025, which subsequently sparked a 56% surge in the XRP/BTC pair and propelled XRP’s dollar price 92% higher to reach $3.66.
Blockchain metrics indicate growing whale-level accumulation activity. Data from analyst Ali Charts reveals that large holders acquired 190 million XRP tokens during the past week alone. Additionally, elevated outflows from exchanges suggest investors are moving holdings to private wallets—behavior typically associated with longer investment horizons.
For bulls to validate a genuine trend reversal, XRP must reclaim territory above the $1.61 range resistance level.