

Key Takeaways
- XRP currently trades at $1.39, experiencing a 3.46% decline over the past day
- The digital asset finds stability at critical $1.40 support zone following recent downturn
- Resistance zone between $1.45 and $1.50 represents crucial breakout level for bulls
- Relative Strength Index registers 46, indicating subdued buying pressure
- Breakdown beneath $1.3850 may trigger further decline toward $1.3620 support
The cryptocurrency is maintaining position near a crucial support threshold following sustained downward pressure. After retreating from its recent peaks, XRP has entered a consolidation phase around the $1.40 mark.
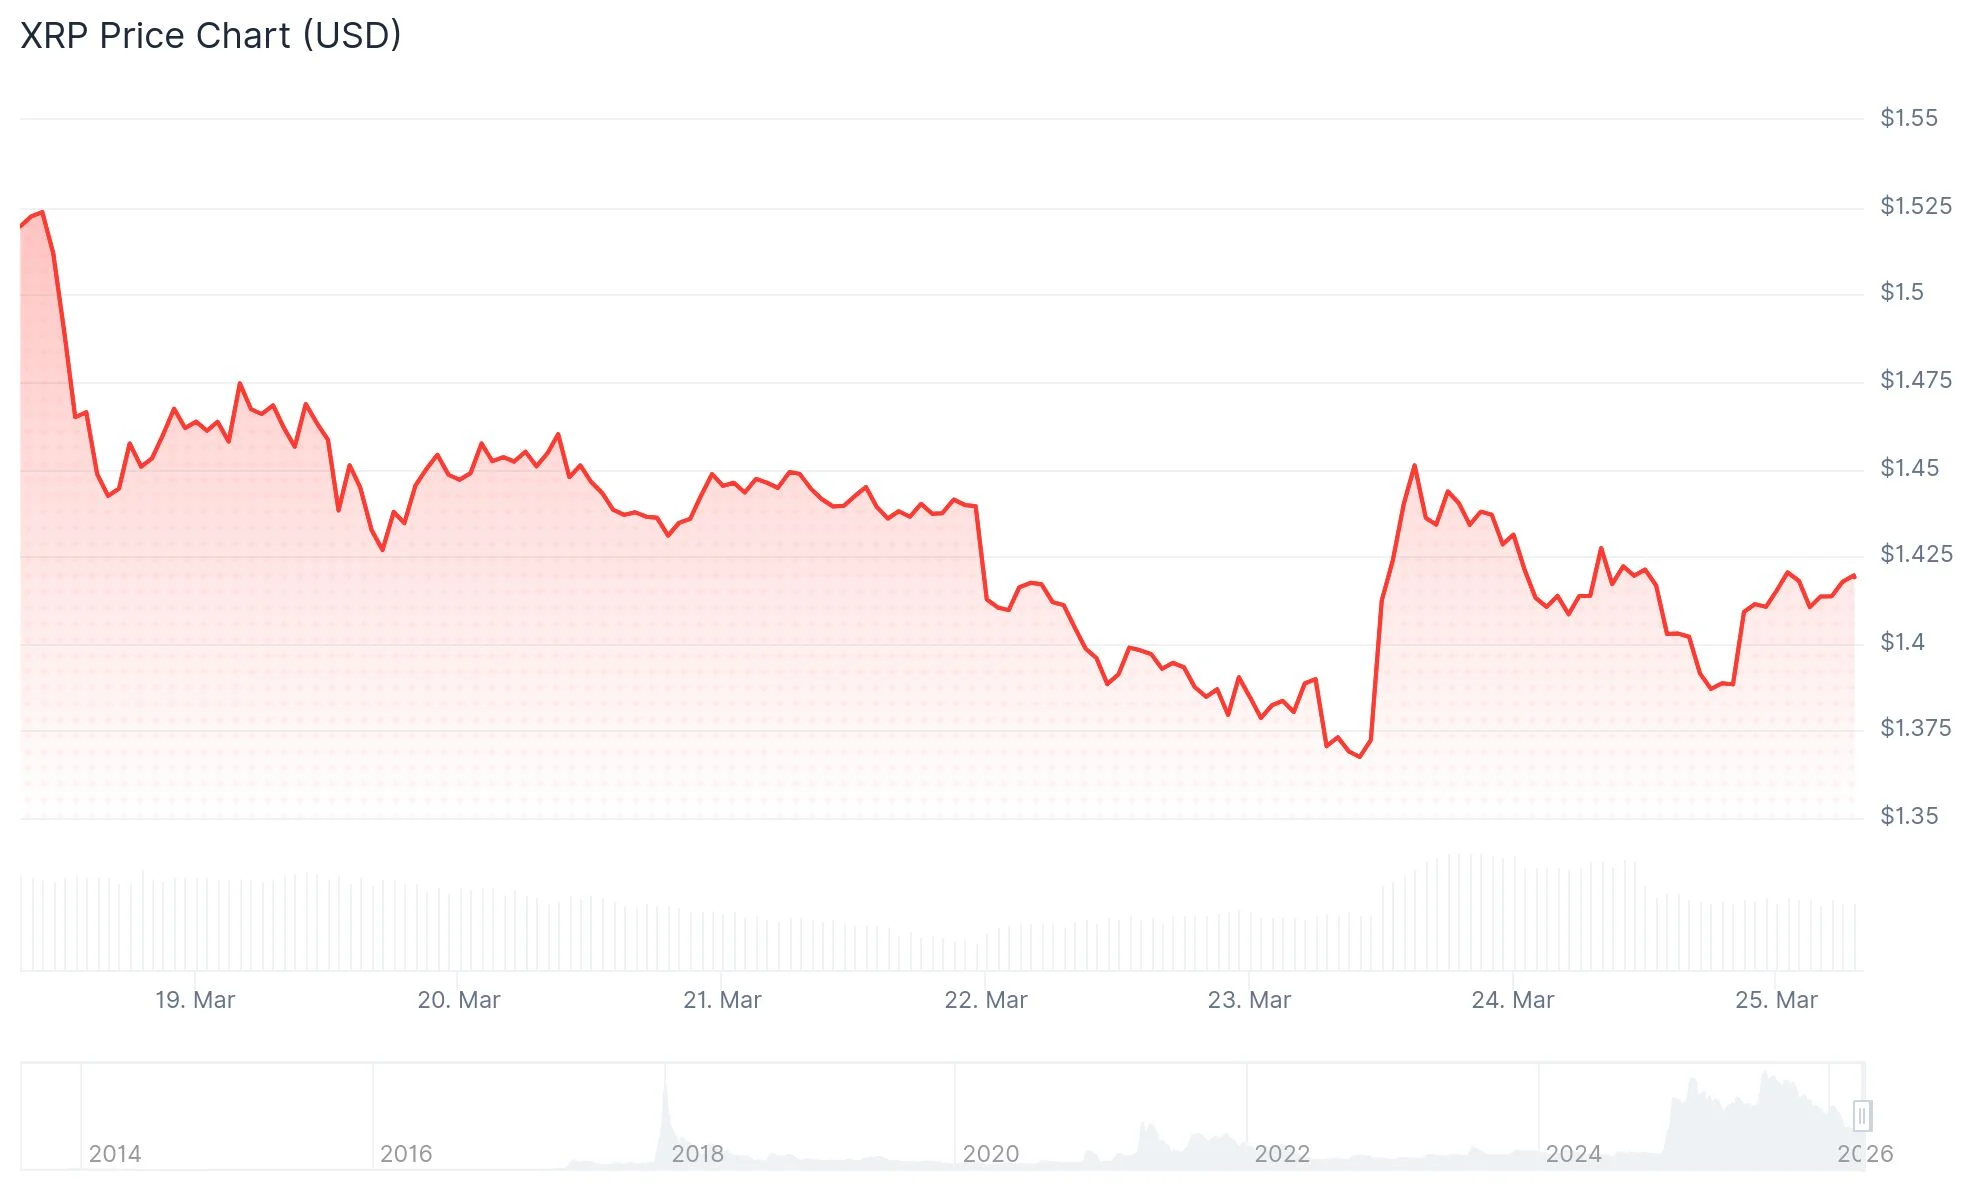
Current market data shows XRP changing hands at $1.39. Daily trading activity totals $3.16 billion while the asset maintains an $85.87 billion market capitalization, per CoinMarketCap figures. The token has shed 3.46% of its value during the previous 24-hour period.
The digital currency initially climbed past $1.41 and $1.42 levels before reaching an intraday peak at $1.4650. This advance triggered profit-taking, resulting in a retracement below both $1.45 and $1.44 thresholds.
Price action declined through the 61.8% Fibonacci retracement level calculated from the $1.3612 low to $1.4650 high. Market participants defended the zone near $1.3850, corresponding to the 76.4% Fibonacci level, preventing additional downside.

Market analyst BitGuru highlighted on March 24 that XRP is navigating through what he identifies as a significant accumulation territory. His analysis indicates the price movement follows a falling wedge breakdown, with XRP potentially establishing support structure at $1.40.
Momentum Indicators Signal Neutral-to-Bearish Stance
The Relative Strength Index currently hovers around 46, remaining beneath the equilibrium line at 50. This positioning indicates continued selling dominance in the near term.
XRP is positioned beneath its 20-day simple moving average at $1.41 and considerably below the 200-day moving average positioned at $2.09. The configuration of moving averages reflects bearish alignment.
The MACD indicator displays flat trajectory while positioned in negative space. The absence of a bullish crossover signal indicates momentum remains unfavorable for buyers at this juncture.
Critical Price Levels for Traders
Regarding upside targets, initial resistance emerges near $1.4250. Clearing this barrier would expose $1.44, followed by $1.4650.
A decisive climb beyond $1.4650 could establish targets at $1.50, subsequently extending toward $1.5250. Bulls require sustained trading above $1.4250 to validate any recovery attempt.
Should XRP struggle to gain upward traction, primary support stands at $1.40. Additional cushions exist at $1.3850, then $1.3620.
A daily close beneath $1.3620 might accelerate selling toward $1.35 or potentially $1.3320.
Technical analyst Ali Charts shared on X that an important trendline may present a compelling accumulation opportunity for XRP, identifying the present support area as a strategic entry point for positioning.
XRP maintains trading above both $1.40 and its 100-hour Simple Moving Average, with market behavior reflecting cautious sentiment among participants as they await directional clarity.