

Key Takeaways
- On June 26, XRP touched $1.009, marking its nearest approach to the dollar level since November 2024
- Spot ETF inflows remained constructive despite downward price action
- Technical analysis reveals a bearish trend extending from July 2025
- Open Interest metrics have stabilized around 400 million XRP, indicating reduced speculation
- Bullish divergence on daily timeframes hints at potential exhaustion of selling momentum near the $1 mark
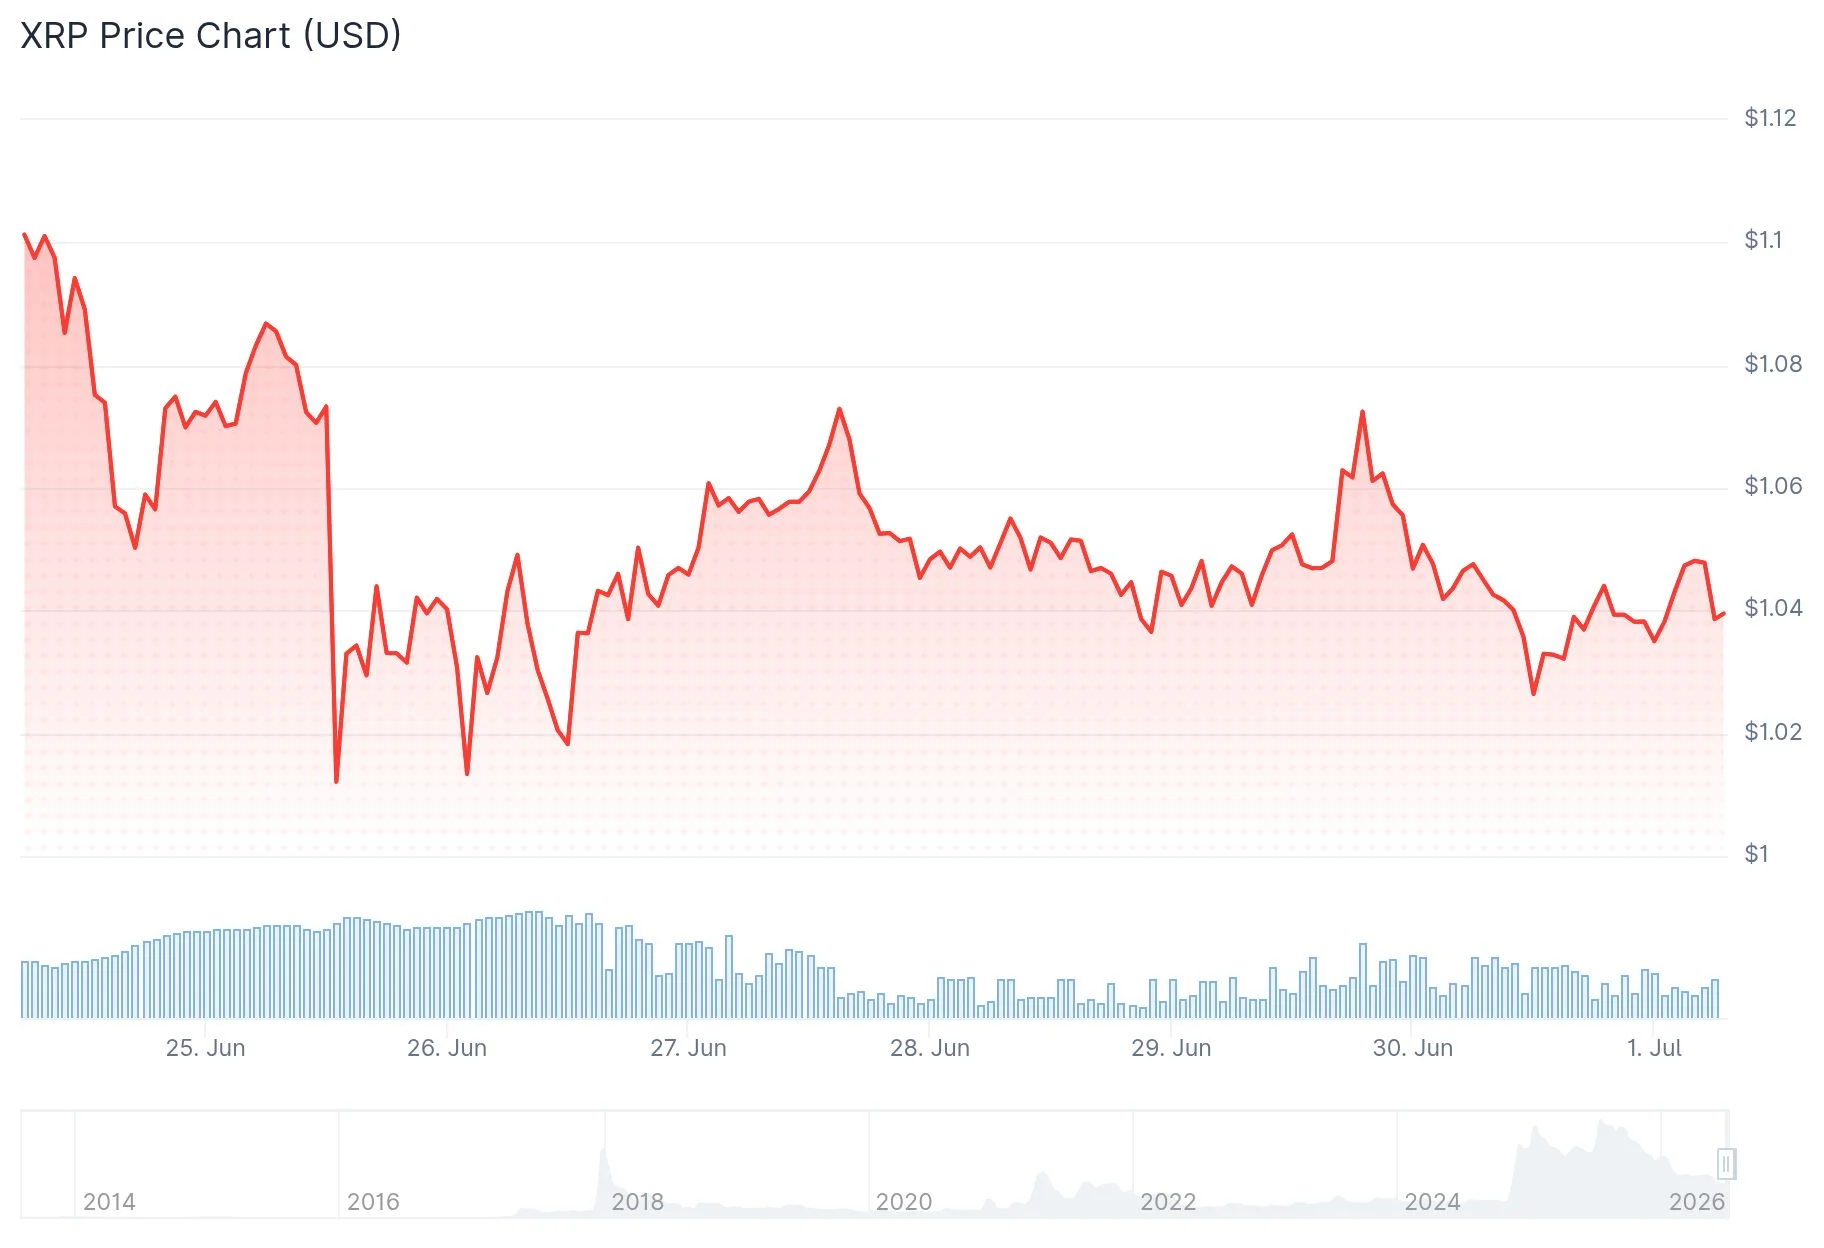
On June 26, 2026, XRP touched an intraday low of $1.009. The digital asset hasn’t traded this close to the psychological $1 threshold since November 2024.
The decline unfolded despite continued capital inflows into XRP-focused exchange-traded funds. Market participants maintained their ETF accumulation patterns throughout the price weakness.
ETF purchases are effectively reducing the circulating supply of XRP available for trading. However, this supply constraint hasn’t generated upward price momentum given the current market environment.
Overall market appetite for XRP has weakened over the past several months. Speculative positioning has likewise contracted.

Technical Analysis Breakdown
The daily timeframe reveals a sustained downtrend for XRP dating back to July 2025. The breach below the April 2025 low of $1.61 in February solidified the bearish structure.
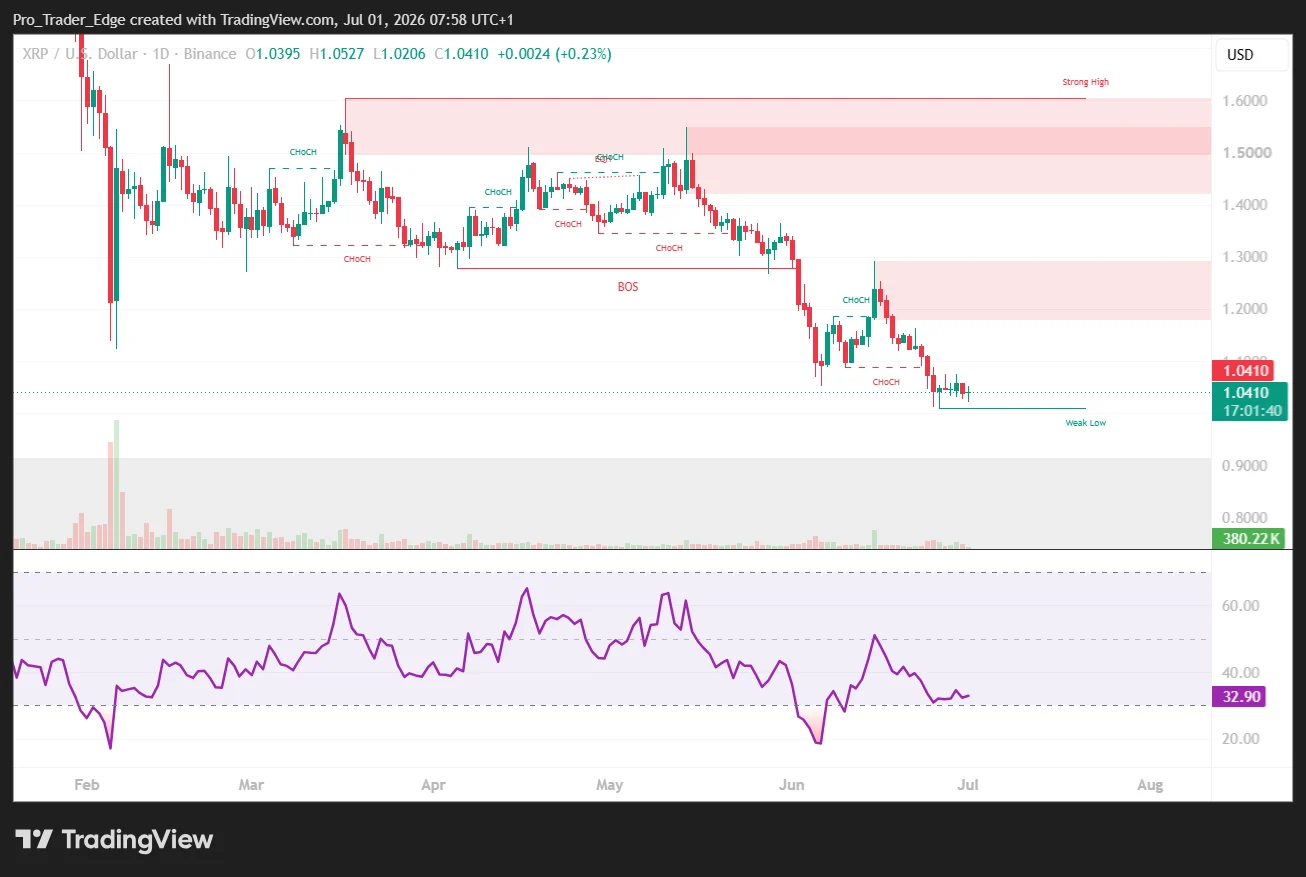
Following that breakdown, XRP consolidated in a sideways range for multiple months. Late May witnessed an aggressive selloff that shattered this consolidation zone and accelerated the decline.
A temporary recovery pushed prices toward $1.30 before momentum faded, bringing the asset back to the $1.05 vicinity.
Derivatives market data reveals Open Interest stabilizing near the 400 million XRP mark. The Open Interest Turnover Ratio has maintained levels around 0.71.
According to analyst Arab Chain, market participants should monitor for sharp increases in these indicators. Sudden expansions in OI or turnover ratio typically precede heightened volatility episodes.
Examining the 4-hour chart, XRP rallied to $1.2935 during mid-June. This advance approached the 78.6% Fibonacci retracement at approximately $1.2985 before encountering resistance.
Bearish targets lie at $0.975 and $0.854 should the downward trajectory persist. Most analysts considered a break below $1 during July more probable than not.
Potential Support Indicators
An alternative technical perspective suggests a more nuanced outlook. XRP has consistently found buyers in the $0.90 to $1.00 band, a demand zone that has withstood multiple challenges.
The $1.13 level has transformed from support into overhead resistance. Recovery above this threshold would indicate strengthening bullish momentum.
A bullish divergence pattern on the daily chart has persisted for approximately seven days. Such formations typically indicate diminishing selling pressure rather than accelerating bearish momentum.
On social platforms, trader Celal Kucuker shared his view that XRP will maintain current support levels and potentially climb to $10 over the next twelve months, though he acknowledged significant volatility along the way.
Technical analyst ChartNerd highlighted a familiar accumulation structure observed during previous bear cycles, referencing historical drawdowns ranging from 85% to 96% spanning 14 to 37 months, contrasted with the current 72% retracement over 11 months.
The $1.00 level remains the critical focal point. Defending this support maintains the possibility of retesting $1.13, while failure would likely trigger movement toward the $0.87 to $0.90 zone.