
 Stock: Unprecedented 8-Month Losing Streak Has Analysts on Alert")
Key Takeaways
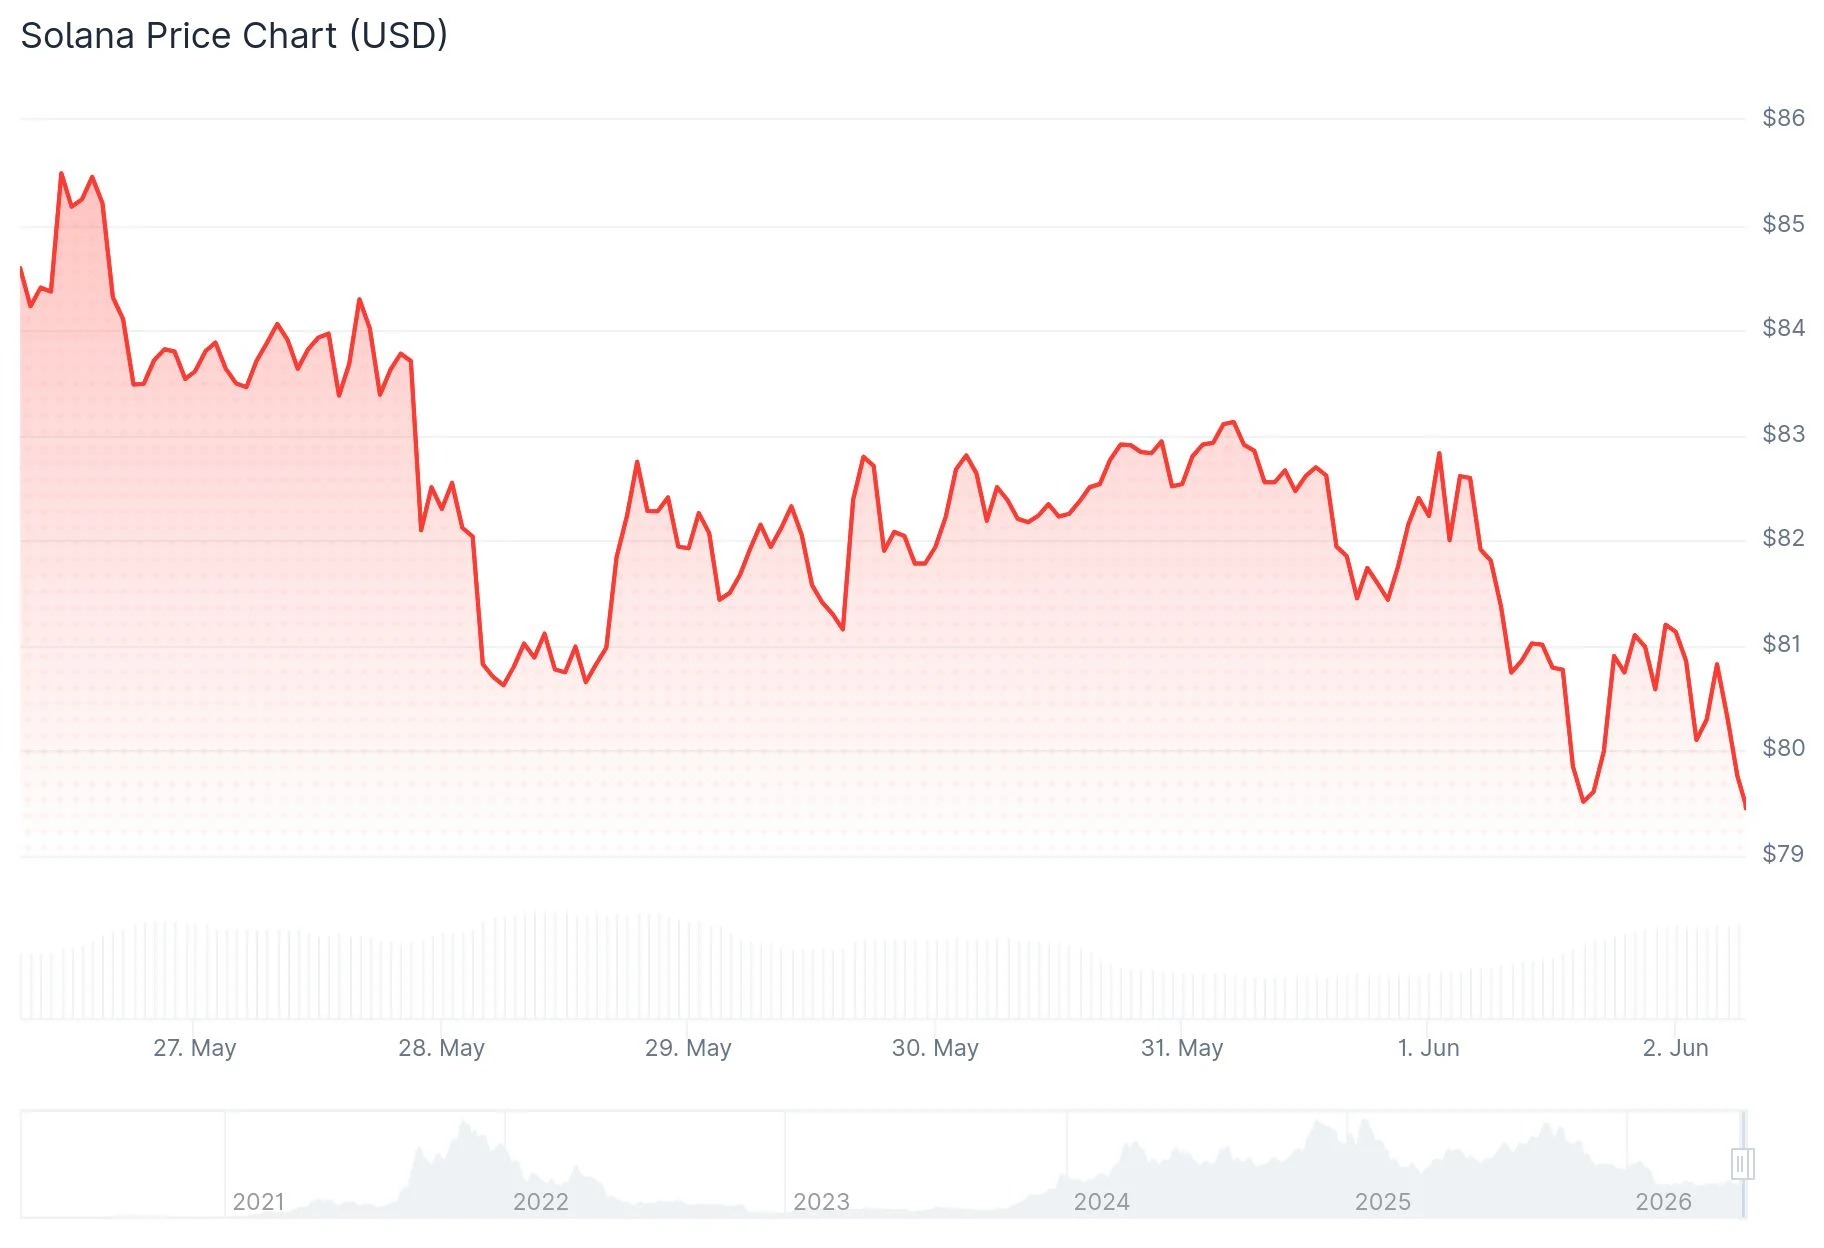
- Solana is currently trading around $79.50, confined within a $76–$90 trading corridor that’s persisted for multiple months
- Network participants have declined sharply from 3 million users to under 2 million; both DEX activity and Open Interest show downward trends
- Short liquidation data reveals concentrated positions between $83–$87, potentially setting up a rapid upward move if breached
- Crypto analyst Crypto Patel highlights an unprecedented occurrence: SOL has recorded 8 straight red monthly candles for the first time in its existence — echoing patterns from the 2021 bear market
- Critical support zone established at $68.02; falling through this threshold would negate the existing bullish technical framework
Solana has experienced persistent downward pressure for several months, with blockchain metrics beginning to mirror this decline. The digital asset currently hovers near $79.50, confined within a trading range that’s remained intact since the beginning of the year.
Participation on the Solana blockchain has decreased considerably from approximately 3 million users in early 2025 to roughly 1.9 million currently. This represents a substantial decline in actual network utilization.
Decentralized exchange activity has similarly contracted dramatically from earlier 2025 peaks. Multi-billion dollar daily volumes have evaporated, with no signs of recovery in this downtrend.
Blockchain Metrics and Futures Markets Show Weakness
Solana derivatives Open Interest has contracted from approximately $3 billion at its peak down to around $2.1 billion presently. Market participants are unwinding positions and reducing leveraged exposure.

The peculiar aspect is that funding rates continue to remain in positive territory. This indicates traders maintain bullish positioning despite deteriorating fundamentals supporting their positions.
From a technical perspective, analyst Man of Bitcoin is monitoring a compression pattern developing on the four-hour timeframe. SOL is being squeezed between converging descending and ascending trendlines, with a breakout appearing imminent. His key level to watch: $68.02. A breakdown below this price point would invalidate the current bullish technical framework.
Should SOL break to the upside, initial resistance emerges around $98, with subsequent targets positioned at $110.54, $120.47, and $126.95.
Analyst CryptoCurb presented a weekly timeframe chart illustrating Solana forming an extended consolidation pattern spanning from 2024 through 2026. His projected eventual target sits at $1,000, though the formation requires confirmation above the upper boundary of the current range.
Crypto Patel Identifies Never-Before-Seen Pattern
Market analyst Crypto Patel published an in-depth analysis on X, highlighting an occurrence without precedent in Solana’s trading history: 8 consecutive monthly closes in the red.
He referenced the 2021 bear market cycle, when Solana plummeted from $260 down to $8. That selloff also produced 9 red monthly candles — though not in consecutive fashion. The 9th candle marked the cycle bottom, after which SOL rallied to establish a new all-time high near $295 throughout the subsequent two-year period.
According to Patel, the 9th monthly candle is currently taking shape, and he’s closely monitoring the $80–$50 range as a probable accumulation area. Should the previous cycle’s pattern repeat itself, he forecasts SOL could reach a new all-time high somewhere in the $500–$1,000 range over the coming one to two years.
On shorter timeframes, liquidation information from Coinglass reveals concentrated short positioning stacked between $83 and $87. Should SOL push into this zone, automatic liquidations could catalyze a swift upward price movement.
Critical downside support remains anchored at $76. Primary upside catalyst resides in the $83–$87 short liquidation cluster.