
 Stock Surges as Bulls Shatter Year-Long Bearish Pattern")
Key Highlights
- SOL shattered a 12-month descending channel pattern, with bulls now eyeing $100, $105, and $115 targets
- The token recaptured its 100-day simple moving average for the first time since October 2025
- Solana-based ETF products attracted $56.6 million in net capital inflows during the past 30 days
- A dormant whale wallet accumulated $6.23 million in SOL during a single trading session
- Critical support is positioned at $92.20, while $98 represents the immediate resistance barrier before the psychological $100 level
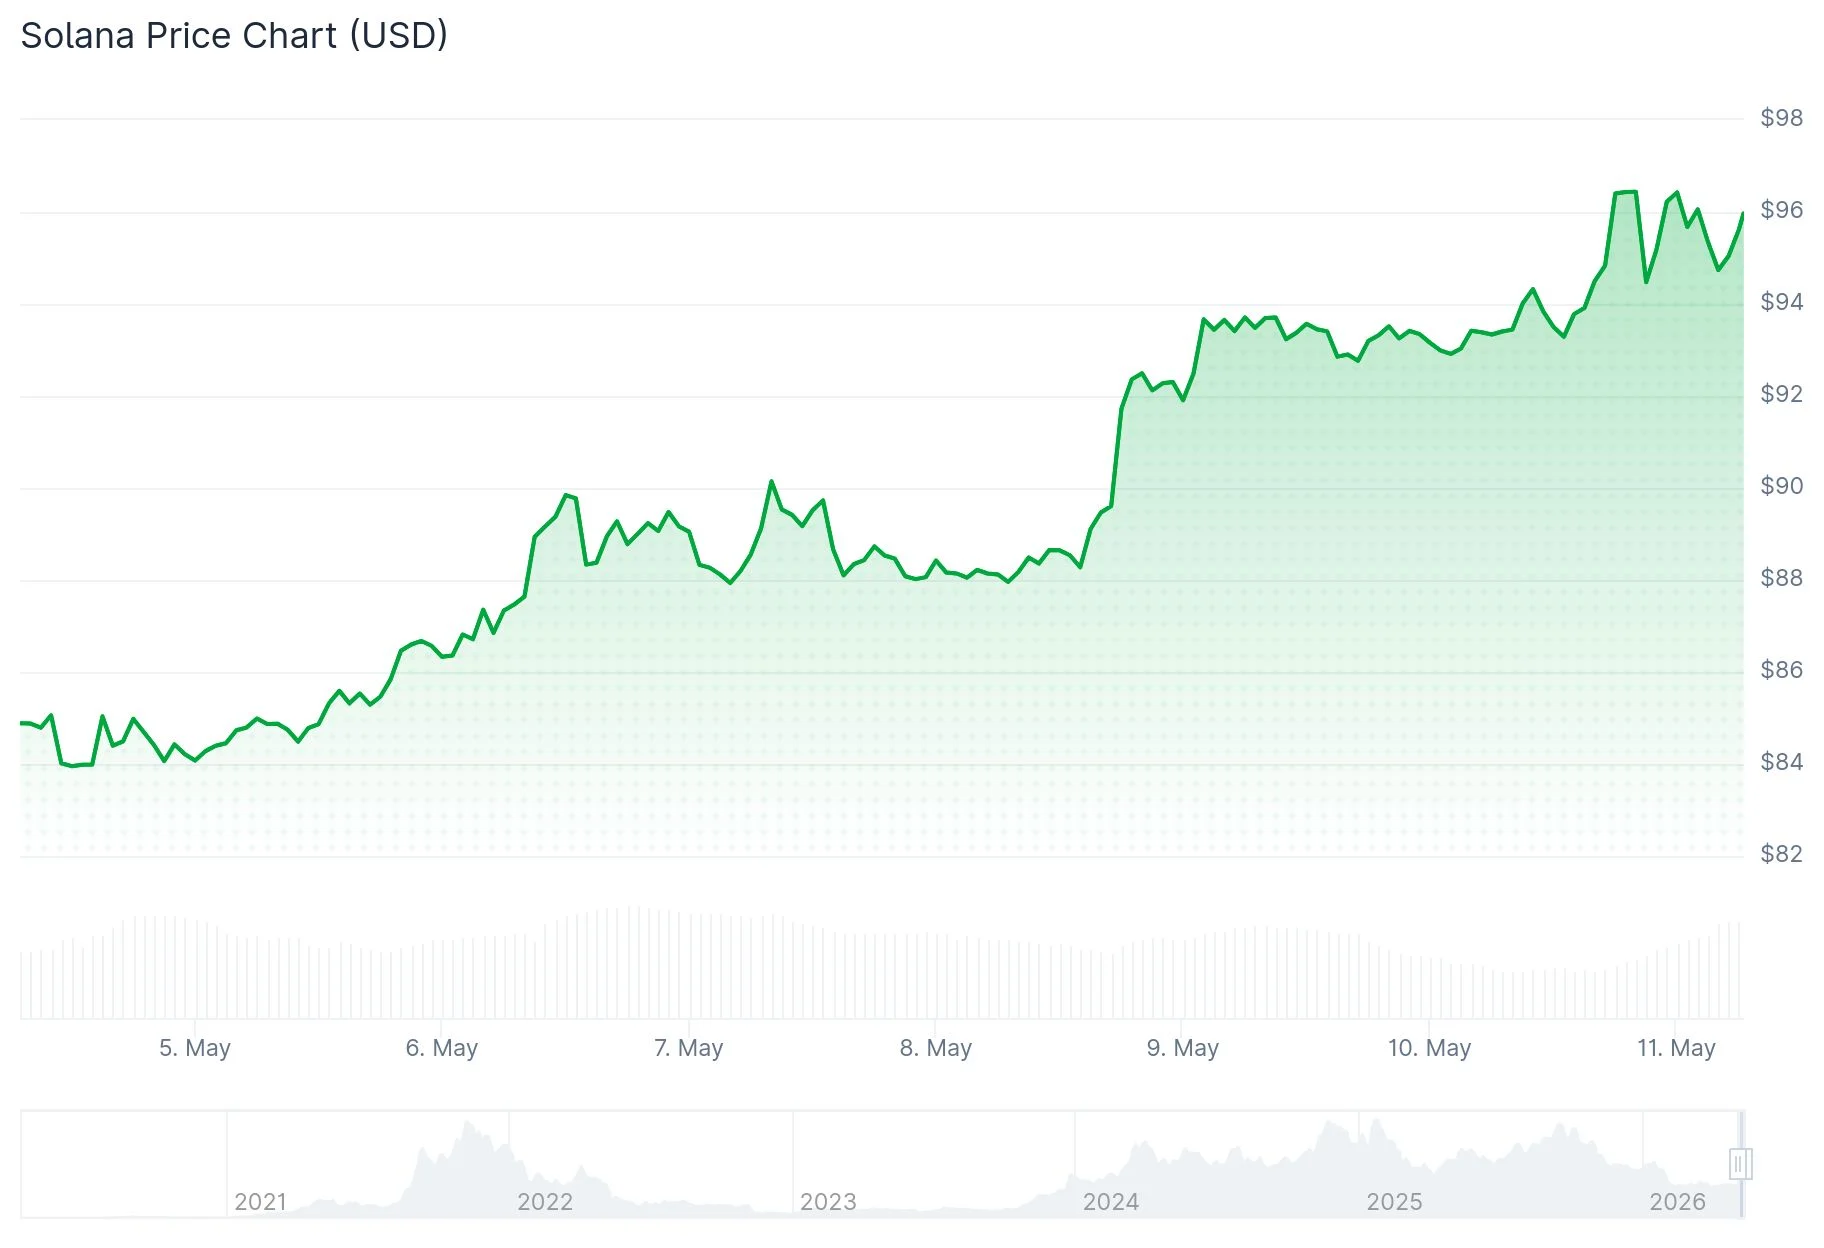
Solana is currently changing hands near $92.90 following a decisive breach above a year-long descending channel formation. This technical pattern originated around the $250 price level and drove the asset down approximately 75% before the current reversal attempt took shape.
The technical breakout has captured significant attention across trading communities and market analysts, though confirmation requires a decisive weekly candle close above the descending trendline. Until this validation occurs, the formation remains in a transitional phase.
Market analyst Ted Pillows highlighted on X that Solana successfully reclaimed its 100-day simple moving average—a milestone not achieved since October 2025. He projected that conditional on Bitcoin maintaining stability, SOL has the potential to advance toward the $100-$105 range. The 100-day SMA previously functioned as formidable resistance for an extended period, making its recapture a meaningful shift in near-term momentum.
Investment Fund Flows and Whale Accumulation Patterns
From a fundamental perspective, Solana-focused exchange-traded fund products have registered $56.6 million in aggregate net inflows throughout the trailing 30-day period, including a single-day injection of $6.7 million. This sustained institutional appetite provides foundational price support.

On-chain analytics revealed that a previously dormant wallet address resumed activity to accumulate approximately $6.23 million worth of SOL in one concentrated buying session. Arkham Intelligence data identified transfers originating from Binance and Wintermute-associated wallets into Fireblocks custody infrastructure, which market observers interpret as strategic repositioning by sophisticated participants.
Analyzing the hourly timeframe, SOL touched an intraday peak of $96.85 before experiencing minor profit-taking. The price maintains its position above the 100-period hourly simple moving average while respecting a short-term ascending trendline with foundational support established near $92.20.
Critical Price Zones Under Surveillance
Immediate overhead resistance is encountered at $96.20, followed by $96.50, with $98 representing the primary level commanding trader attention. A confirmed settlement above $98 would potentially unlock pathways toward $102 and subsequently $105.
Regarding downside protection, support layers are positioned near $94, then $92.20, while a breakdown beneath $90 could redirect price action toward the $88 region.
Analyst Trader Symba characterized the current price territory as a pivotal inflection point. A validated breakout scenario could propel targets toward $115, whereas rejection from these levels might trigger retracement toward $70.
The SOLETH trading pair is also defending a strategic support corridor spanning 0.032 to 0.040 ETH. Analyst TraderSZ assessed that the pair appears to have established a bottom formation and that Solana could demonstrate relative strength versus ETH if this structural foundation maintains integrity.
SOL is presently trading at $92.90, registering a 0.72% decline over the previous 24-hour period, with the $98 resistance threshold serving as the immediate challenge for bullish continuation.