
 Stock Surges 6% — Can Bulls Break Through $88 Resistance?")
Key Takeaways
- SOL surged past the $82 and $85 thresholds following a bullish flag pattern confirmation on the 1-hour timeframe.
- The token peaked at $87.04 before experiencing a minor retracement to stabilize around mid-$80s levels.
- Bulls face a critical resistance barrier between $87.20 and $88.
- Key downside protection levels are positioned at $83.75, followed by $82.70, and ultimately $80.
- Technical indicators reveal conflicting signals with short-term strength but caution on extended timeframes.
On April 8, Solana (SOL) demonstrated notable upward momentum as buying pressure drove the cryptocurrency beyond both the $82 and $85 price markers. This advancement has positioned SOL within a constructive short-term technical framework.
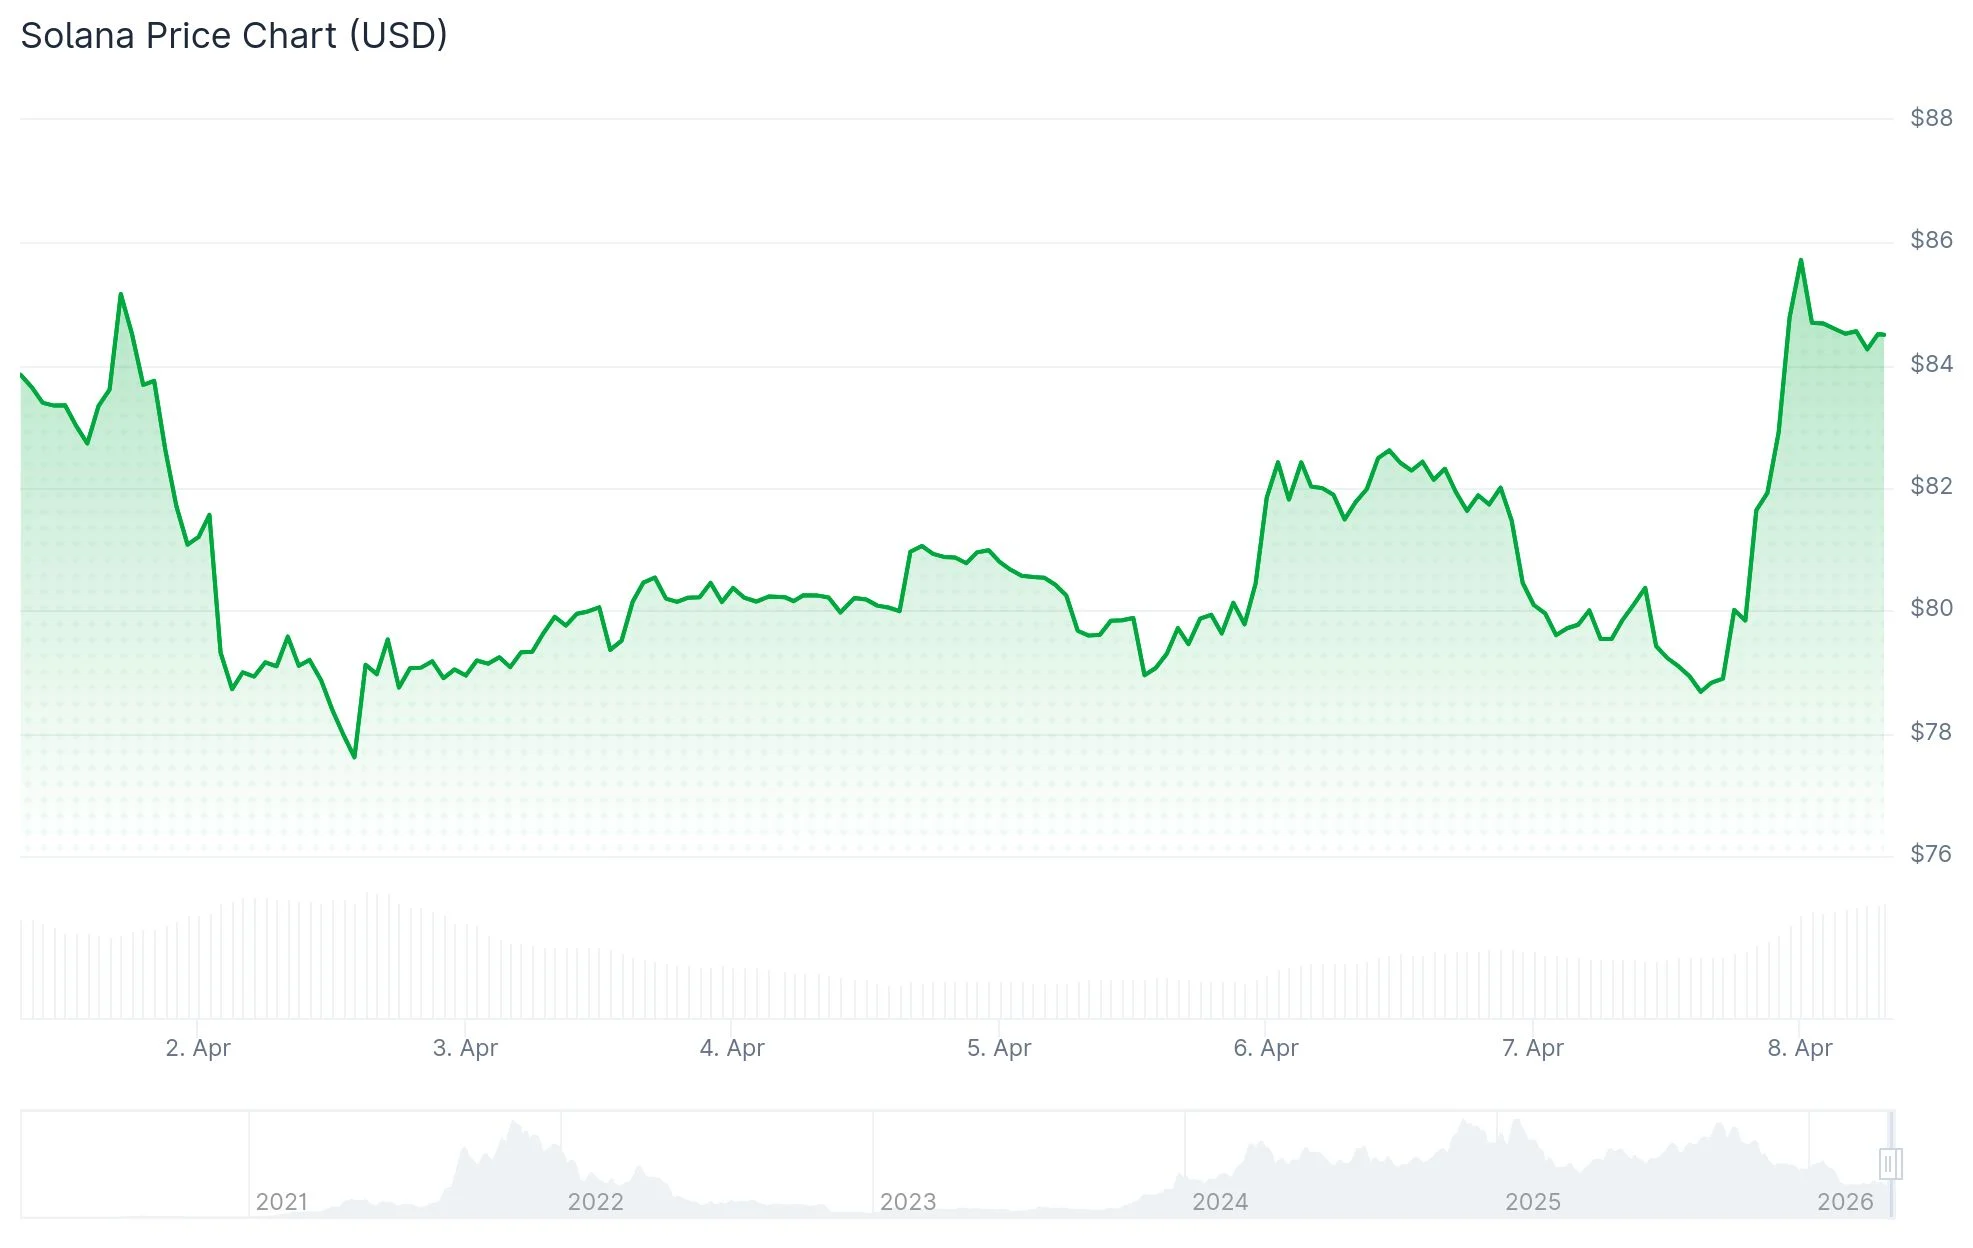
The digital asset established an intraday high at $87.04 before encountering selling pressure. Following the pullback, SOL consolidated between $84 and $85, successfully maintaining the majority of its daily gains.
Technical chart analysis on the hourly timeframe reveals SOL successfully breached a bullish flag formation that had established resistance near the $80 threshold. This breakout served as the catalyst for the current uptrend.
Currently, SOL maintains its position above the 100-hour simple moving average, a technical signal that reinforces bullish sentiment and directs focus toward approaching overhead resistance.

The immediate overhead challenge appears near $85, while the more significant resistance zone clusters around the $88 level.
Should buying momentum successfully penetrate the $88 ceiling, subsequent resistance targets emerge at $95 and $102. Extended bullish continuation could potentially unlock movement toward $112.
Recent Advance Confronts Technical Barriers
According to market data, SOL registered a 5.85% daily gain, bringing its trading price to approximately $84.18. This positioning places the token marginally beneath both its 20-day and 50-day moving averages.
Analysis also identifies the 200-day moving average substantially elevated at $134.10. Meanwhile, the Ichimoku Kijun indicator near $87.19 represents the nearest resistance boundary.
This technical setup emphasizes the importance of the $87.20-$88 zone. Currently, SOL remains engaged in testing this critical price range.
Momentum oscillators present a nuanced picture. While the RSI indicator suggests modest bullish bias, both Stochastic RSI and BBP readings signal potentially overextended conditions following the sharp advance.
Technical projections suggest an anticipated trading band between $83.50 and $86.50 for the immediate term unless a decisive breakout or breakdown materializes. This aligns with the current post-rally consolidation behavior.
Downside Protection Zones Under Observation
Should Solana prove unable to conquer the $88 barrier, downside risk increases. The first line of defense appears near $83.75.
A more substantial support foundation exists around $82.70, coinciding with the 50% Fibonacci retracement calculated from the recent advance between $78.38 and $87.04. Below this level, market participants are closely monitoring the psychologically important $80 zone.
A definitive close beneath $80 would likely trigger further weakness toward $75, effectively negating the recent bullish structure.
Technical analyst Ali Charts noted that Solana continues trading within a broader consolidation pattern, bounded by resistance at $96.04 and support at $76.66. According to his assessment, the upcoming 48-hour period could prove decisive for April’s trajectory, with sustained support potentially triggering rebounds toward $81 and $85, whereas a violation below $76.66 might activate downside targets near $68.54.
Additional market context includes new security initiatives launched by the Solana Foundation alongside recent regulatory developments in the United States. However, the immediate technical situation revolves around price action: SOL achieved a rally to $87.04 and now faces the crucial test of whether accumulation can overcome the $87.20-$88 resistance barrier.