
 Stock Recovers From $80 Floor, But Analysts Warn of Deeper Pullback Ahead")
Key Takeaways
- Solana climbed 3% over 24 hours following a test of the $80 support zone
- Volume jumped nearly 90%, hitting $3.7 billion in daily turnover
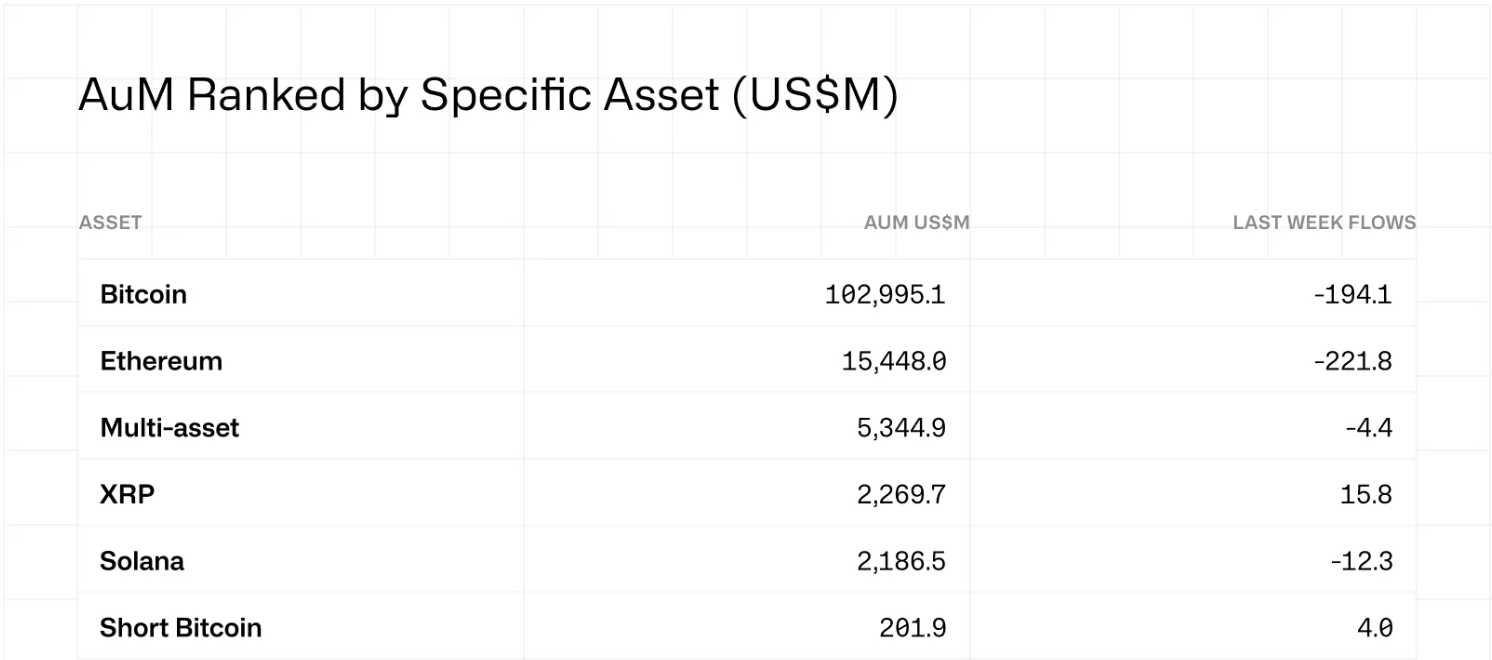
- Digital asset ETFs experienced $414 million in redemptions during their first negative week since early April
- Critical resistance stands at $84–$85; losing $78 may trigger a decline toward $67
- Market observers identify $70–$80 as a potential long-term buying range
Solana is currently changing hands near $82 following a rebound from the psychologically significant $80 threshold. While the 3% uptick over the last day snapped a four-session decline, market analysts caution against interpreting this as a definitive turnaround.
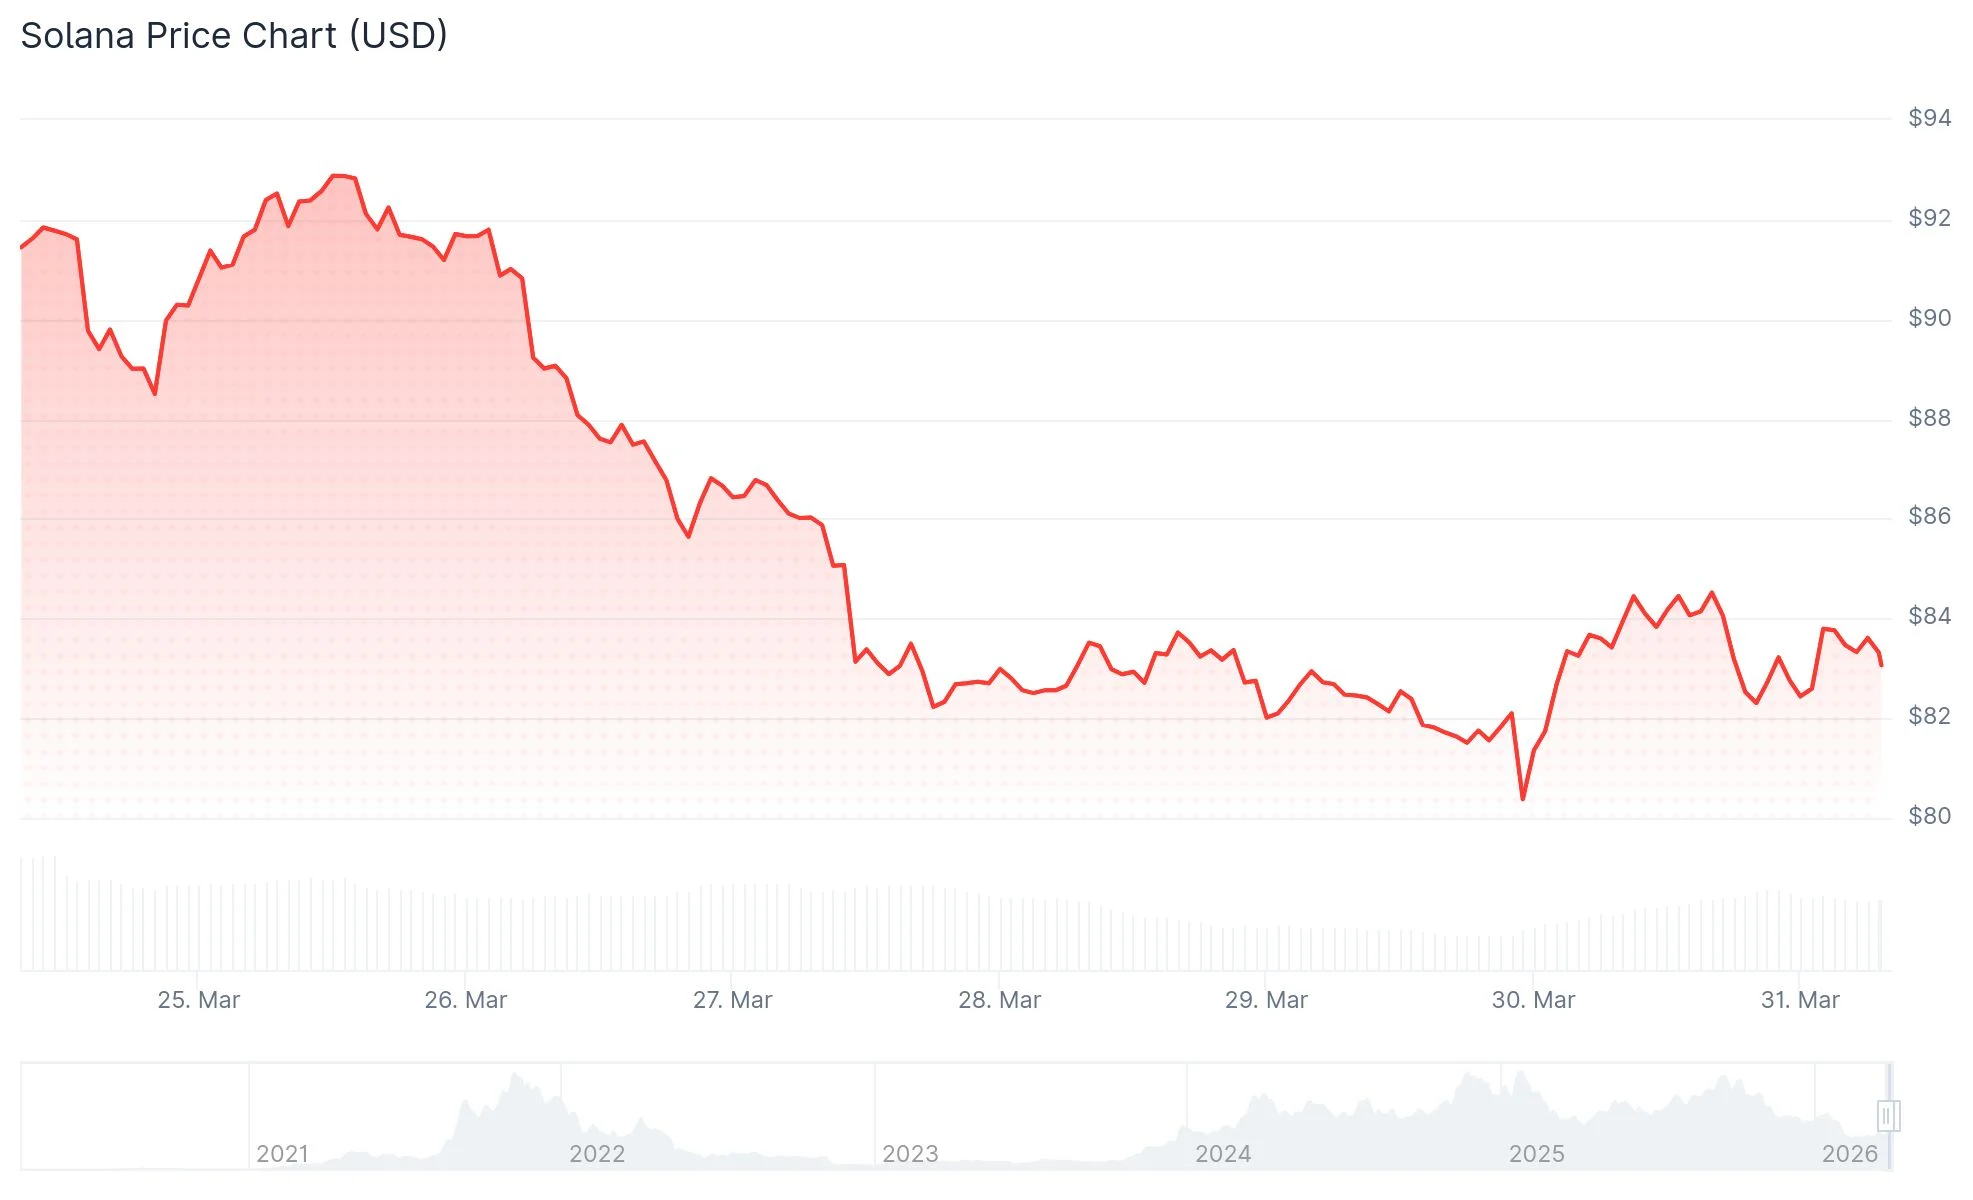
Daily trading activity surged by approximately 90% throughout this timeframe, climbing to $3.7 billion. This figure represents around 8% of SOL’s entire circulating valuation.
The recovery at $80 appears to be a technical response to a psychological price floor. Institutional limit orders may have clustered around this benchmark, though this activity doesn’t necessarily indicate a sustained reversal.
To signal genuine strength, SOL must recapture the $90 threshold. Such a move would demonstrate a breakout from the existing range-bound pattern.

The Relative Strength Index has declined beneath 40 and crossed below its 14-period average. This configuration suggests mounting downside pressure over the near term.
Critical Price Thresholds Under Surveillance
The $84–$85 area represents the initial overhead barrier SOL faces. This region previously functioned as a floor before the recent breakdown, making its reclamation an encouraging development.
Should buyers defend territory above this range, technical observers anticipate potential advancement toward $88, followed by $92. Conversely, inability to maintain $82 may prompt another challenge of the $78 demand area.
A breach beneath $78 constitutes the primary downside threat. Market technicians warn that such a development could drive Solana down to $67, matching the February 6 trough—representing approximately 20% downside from present levels.
Chartist Ali Charts highlighted on X that downside objectives of $74.11 and $50.18 remain relevant for SOL should the prevailing bearish structure persist.
Broader Market Headwinds Intensifying Pressure
Digital currency ETFs registered $414 million in net withdrawals during the previous week, halting a month-long run of positive flows. CoinShares strategist James Butterfill attributed this shift to mounting anxiety surrounding the Iran situation and accelerating inflation projections.
Crude oil valuations have rebounded above $100 following a temporary retreat below $90. The Strait of Hormuz blockade persists, sustaining elevated energy costs.
Escalating energy expenses amplify inflation concerns, potentially compelling the Federal Reserve to maintain restrictive monetary policy for an extended period. Such conditions typically disadvantage speculative assets including cryptocurrencies.
The Crypto Fear and Greed Index tumbled from 46 (Neutral territory) to 27 (Fear zone), capturing the prevailing risk-averse sentiment across markets.
Market commentator Ted Pillows noted on X that corporate Solana treasuries maintain selling activity, while meaningful buy-side interest remains absent. He projected $50 SOL as achievable during 2026.
At publication time, SOL trades at $82.30 with weekly losses hovering around 10%.