
 Stock Rallies 20%: Analysts Track Critical Resistance Level at $75")
Key Highlights
- SOL has jumped more than 20% from its June bottom near $60, currently hovering around the $75 mark
- The cryptocurrency is challenging a crucial prior support level at $75.7 that may unlock moves toward $83.5, $90, and $98
- Technical analyst Satoshi Flipper identifies a falling wedge pattern breakout with a projected long-term objective of $250
- Trader Daan Crypto Trades notes SOL attempting to break out from a rallying wedge formation against BTC, monitoring for continuation
- Analyst Crypto Coral cautions about a bearish flag pattern breakdown, suggesting rejection risk could drive prices lower
Solana has mounted an impressive comeback from its June bottom, gaining over 20% in recent trading sessions. This rally has positioned SOL at a pivotal price zone that may dictate its trajectory in the coming weeks.
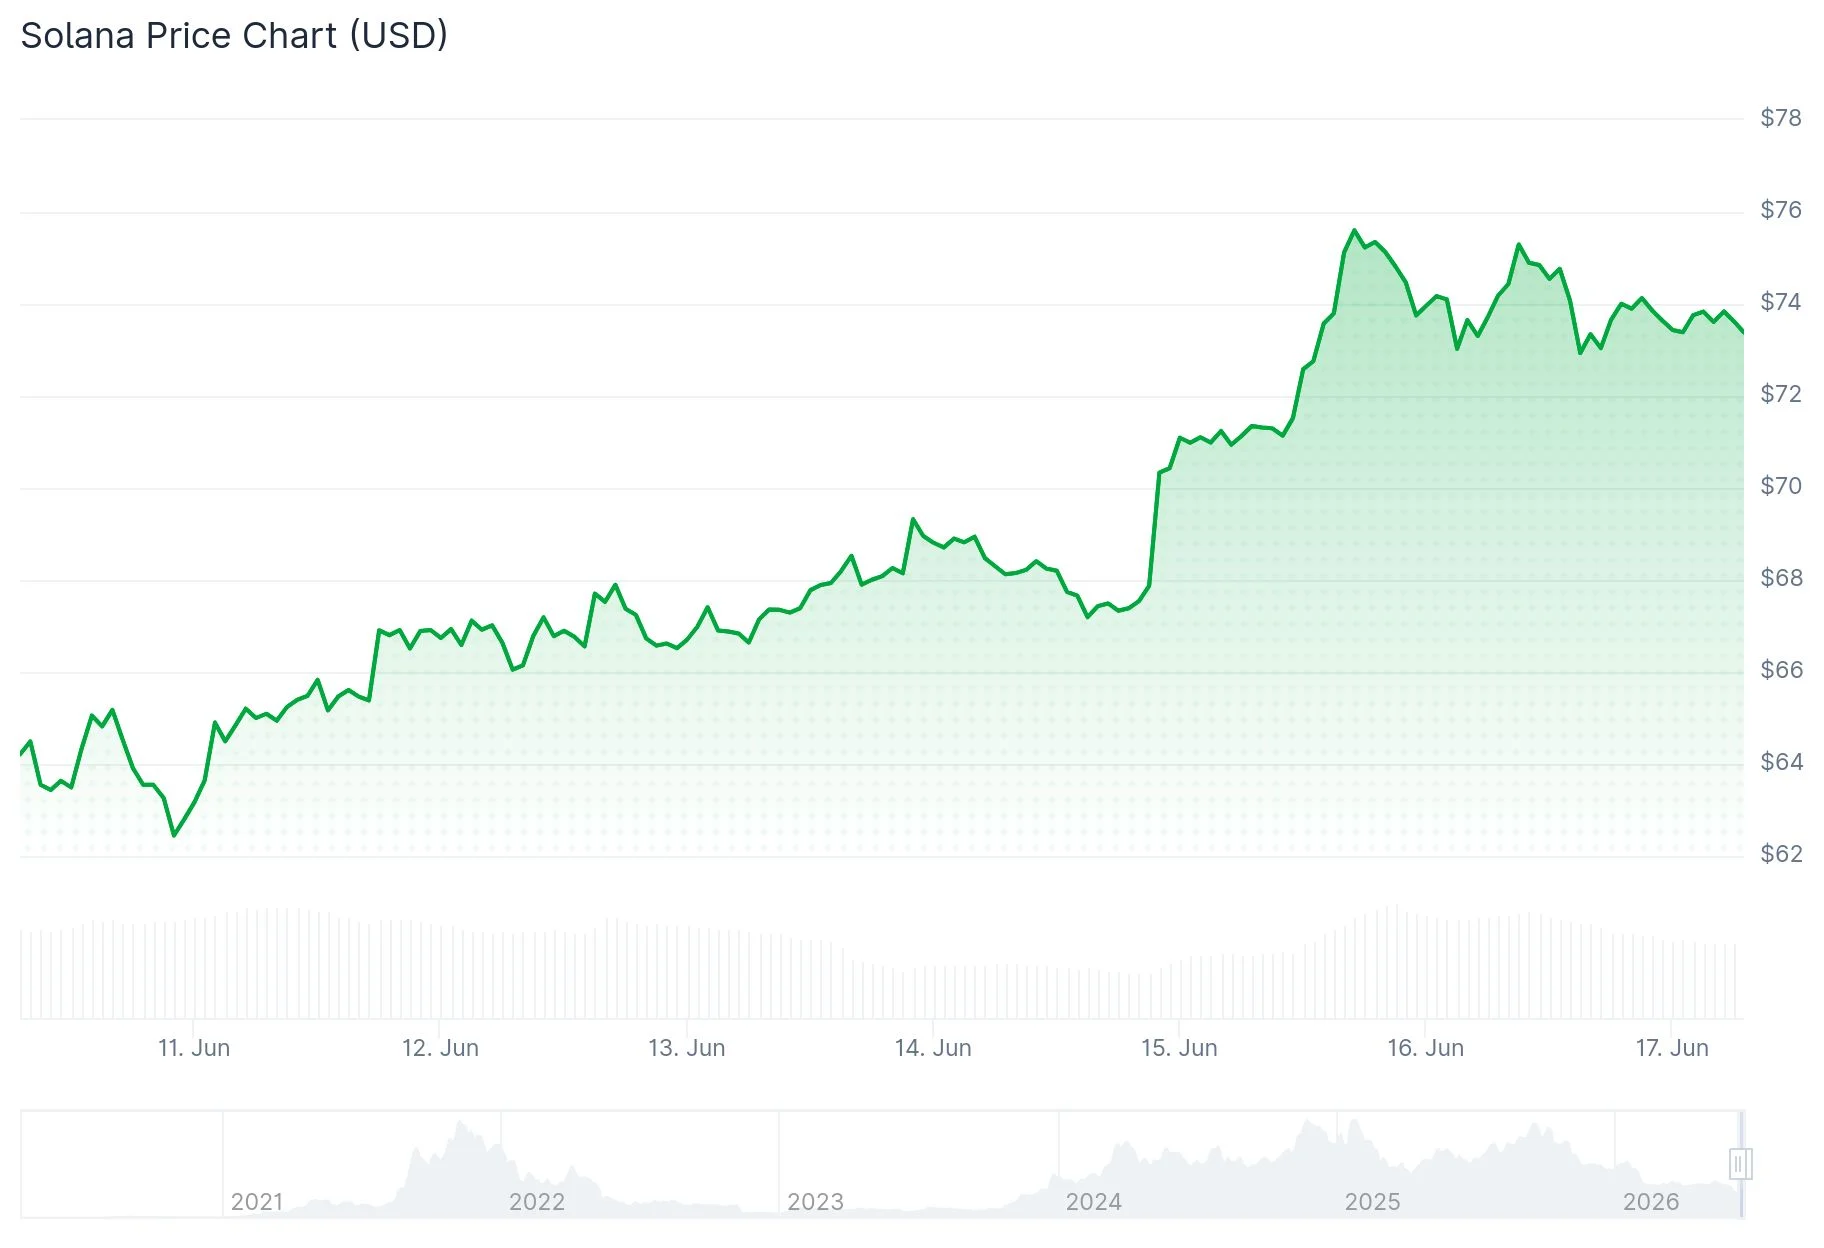
On June 16, Solana was changing hands near the $75 level, marking a substantial advance from the approximately $60 low established earlier this month.
The rebound received support from broader market developments. News emerged that the United States and Iran had negotiated a framework deal to restore access through the Strait of Hormuz, alleviating inflationary pressures. Crude oil values declined following the announcement, prompting gains across Bitcoin, Ethereum, and alternative cryptocurrencies.
Derivatives market indicators confirmed the strength of the move. Data from CoinGlass revealed open interest expanding in tandem with the price advance. Forced liquidations of bearish positions contributed momentum to the climb from the low $60 range to present levels.

On the corporate front, Solana Company turned down a non-binding takeover bid from Forward Industries on June 15. The proposal offered a premium valuation above current market prices and emerged amid growing competition among companies seeking to develop SOL-focused treasury positions.
Technical Chart Analysis
Examining the daily timeframe, Solana consolidated for approximately four months within a trading range bounded by $75.7 support and $98.3 resistance. This pattern collapsed in early June as price penetrated below the range floor and descended toward $60.
SOL has now rallied back to challenge that previous support boundary. A decisive daily close above the range would negate the breakdown and bring $83.5, $90, and ultimately $98.3 back into realistic reach.
Looking at the four-hour timeframe, SOL has pierced above a downward-sloping trendline that had limited rallies since late May. The RSI indicator has recovered above the 50 centerline after reaching oversold territory, while the MACD histogram has begun showing positive momentum.
Trader Daan Crypto Trades shared on X that SOL appears to be breaking out from a rallying wedge consolidation pattern versus BTC. He observed that a successful break could trigger additional upside and benefit various SOL ecosystem tokens, though he emphasized the current zone represents meaningful resistance.
Satoshi Flipper spotted a falling wedge breakout pattern on the daily chart, with price recapturing the upper boundary near $70. This analyst established a long-range price objective at $250, a level corresponding to valuations witnessed during Solana’s previous bullish cycle peak.
Key Resistance Zones and Downside Risks
More Crypto Online drew attention to a concentrated Fibonacci resistance cluster ranging from $69.44 to $72.58 on the four-hour chart, where the 38.2% retracement level, 100% Elliott Wave extension, and 50% retracement converge.
Not every market observer maintains a bullish outlook. Crypto Coral cautioned on June 16 that Solana had experienced a breakdown from a bearish flag formation and is now retesting critical EMA resistance levels. This analyst suggested that without bulls reclaiming that threshold, another downward move remains probable.
Should the $75 zone fail to provide support, subsequent levels warranting attention include $71.8, $69.1, and the June low around $60.
The Supertrend indicator on the four-hour chart presently identifies support in the vicinity of $70.9.