
 Stock Mirrors Historic Bullish Setup as $70 Resistance Comes Into Focus")
Key Takeaways
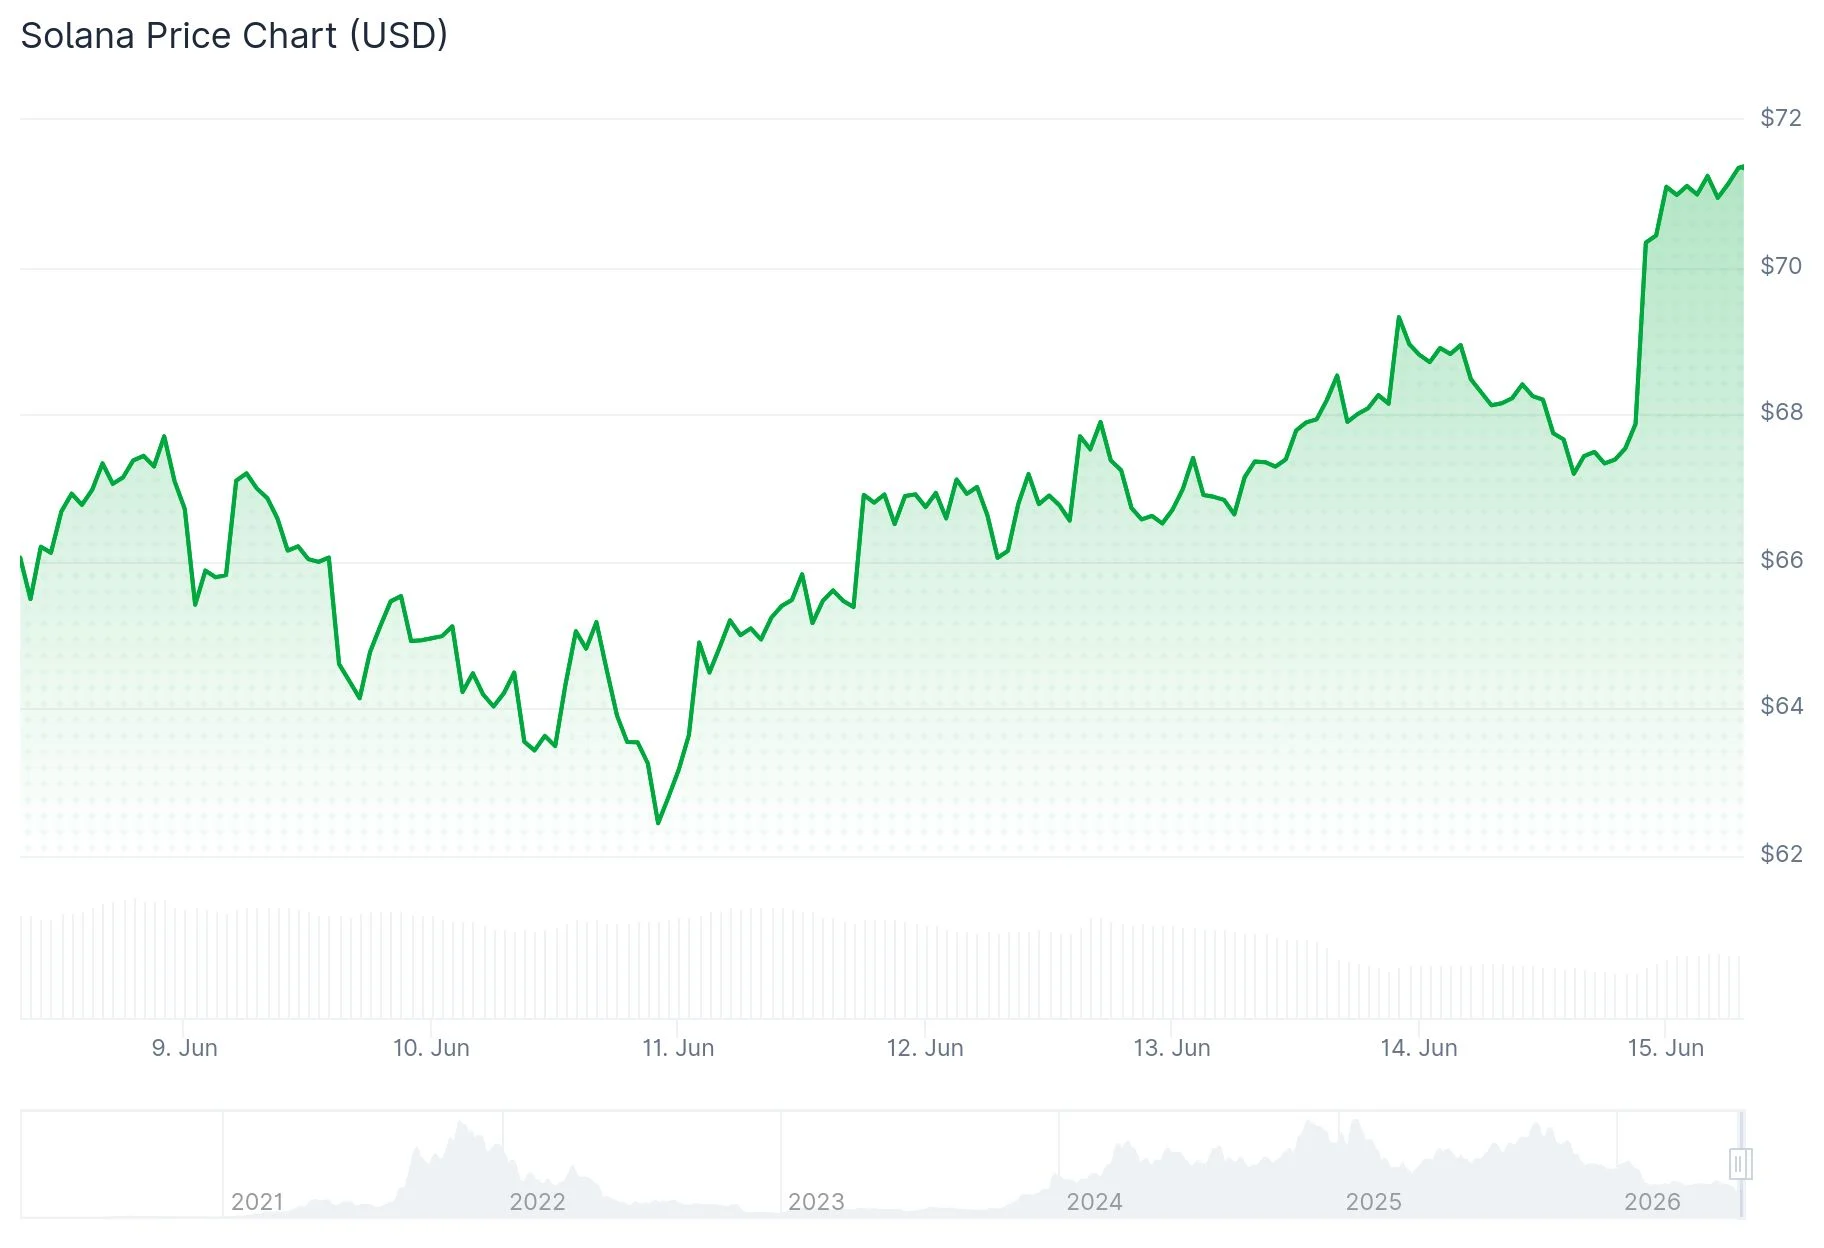
- Solana is hovering near $71 following a rebound from critical support at $60
- Technical analyst Matthew Dixon warns that the upcoming FOMC decision poses macro uncertainty around the $70 mark
- Derivatives data shows open interest edging up 0.29% to $4.72B while volume declined 25.83% to $4.17B
- Technical analyst BATMAN identified a weekly MACD bullish divergence pattern similar to SOL’s prior major rally
Solana has staged a comeback from the crucial $60 support zone, with the token now consolidating around $71. This positioning places SOL at an inflection point that could determine its short-term trajectory.
Market analyst Daan Crypto Trades pinpointed $67 as the February bottom—a threshold that SOL needs to successfully reclaim and maintain to confirm a bullish structure. A breakdown below this level would likely result in a retreat toward the $60 zone.
Should Solana manage to sustain price action above $67, the analysis suggests potential upside objectives at $79 and $95 based on weekly chart structures.
On the shorter timeframe, analyst Matthew Dixon is monitoring the $68–$70 resistance band on the 4-hour chart. He observed that SOL has climbed back from oversold RSI territory and is progressing through Fibonacci retracement levels after its bounce from $60.

Dixon also highlighted the approaching FOMC meeting as a factor that could influence near-term price action. Should the Federal Reserve adopt a more aggressive stance, risk-on assets like Solana may face downward pressure, potentially limiting gains around the $70 threshold.
Crypto technical analyst BATMAN drew attention to a significant development: SOL’s weekly MACD indicator has formed a bullish divergence pattern emerging from the same wedge breakout configuration that signaled the start of a prior substantial bull cycle—a setup that has captured trader attention.
Futures Market Signals Mixed Sentiment
Derivatives metrics reveal a modest 0.29% increase in open interest, bringing the total to $4.72 billion. Meanwhile, trading volume experienced a sharp 25.83% contraction to $4.17 billion, indicating that while positions remain open, active participation has waned.
The current funding rate stands at -0.0023%, reflecting a mildly bearish tilt in trader sentiment. Market participants are maintaining exposure but demonstrating a cautious approach.
On June 14, analyst BitGuru observed that Solana appears to be finding its footing near a significant support threshold, with accumulation beginning to surface.
BitGuru’s short-term price objective points to the $80–$82 corridor, identified as the next resistance barrier should bullish momentum persist.
Current Market Status
At press time, Solana was changing hands at $71 with 24-hour trading volume reaching $2.76 billion and a market capitalization of $39.27 billion. The asset posted a 1.26% decline over the previous 24-hour period.
In Matthew Dixon’s longer-term perspective, he continues to anticipate a market bottom formation around October, correlating with Bitcoin’s halving cycle dynamics. His view characterizes the present upward movement as a temporary relief bounce unless SOL can establish sustained strength above the $70 level.