
 Stock Eyes $100 Breakout as On-Chain Metrics Surge")
Key Takeaways
- SOL stock is currently challenging resistance at its 50-day EMA around $75, which may unlock additional upside potential.
- Growing retail enthusiasm is evident through increased funding rates and Open Interest maintaining levels above $5 billion.
- ETF flows present a contradictory picture, with Solana funds experiencing a $2.50 million outflow following a previous day’s $5.52 million inflow.
- Network statistics from Grayscale reveal approximately 100 million transactions daily with 4.3 million active users per day.
- Crypto analyst Michaël van de Poppe suggests a breakthrough past $77 resistance could propel SOL toward the $125-$130 range.
Solana currently changes hands around $75 this Wednesday. The cryptocurrency is probing its 50-day Exponential Moving Average, a technical benchmark that market participants closely monitor for directional cues.
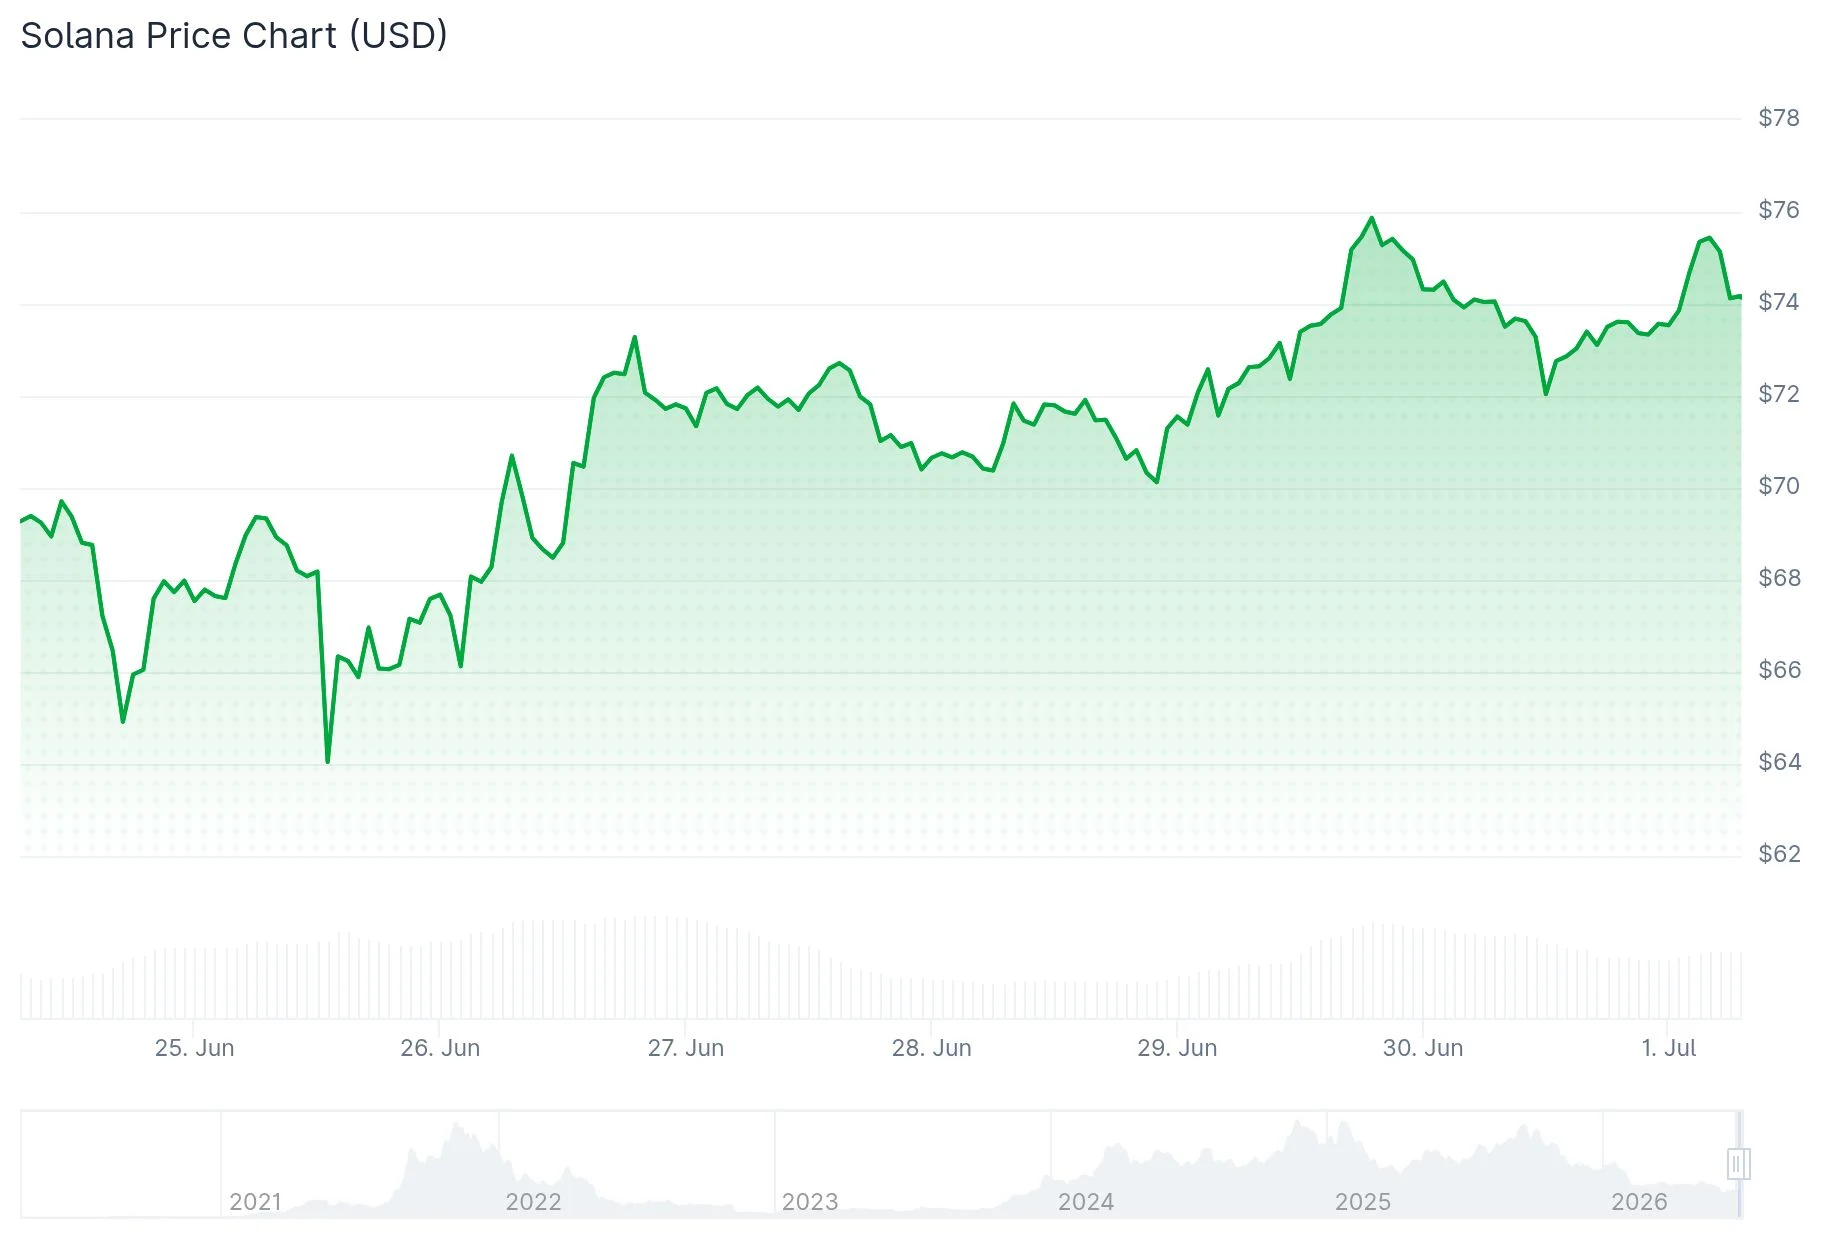
Successfully closing above this moving average could clear the way toward the 200-day EMA, positioned near $98.79. Such a move would bring SOL tantalizingly close to recapturing the psychologically significant $100 threshold for the first time in several weeks.
Retail participation shows signs of acceleration. According to CoinGlass metrics, Open Interest stands at $5.33 billion, maintaining its position above the $5 billion mark following last month’s decline.
Funding rates, which reflect the cost traders pay to maintain long derivative positions, climbed to 0.0073% on Wednesday. This uptick indicates market participants are prepared to accept higher costs to maintain bullish exposure on SOL.

Institutional Capital Flows Remain Uncertain
Exchange-traded fund movement has displayed inconsistency. Solana-tracking funds recorded $2.50 million in withdrawals on Wednesday, completely reversing the previous day’s $5.52 million in deposits.
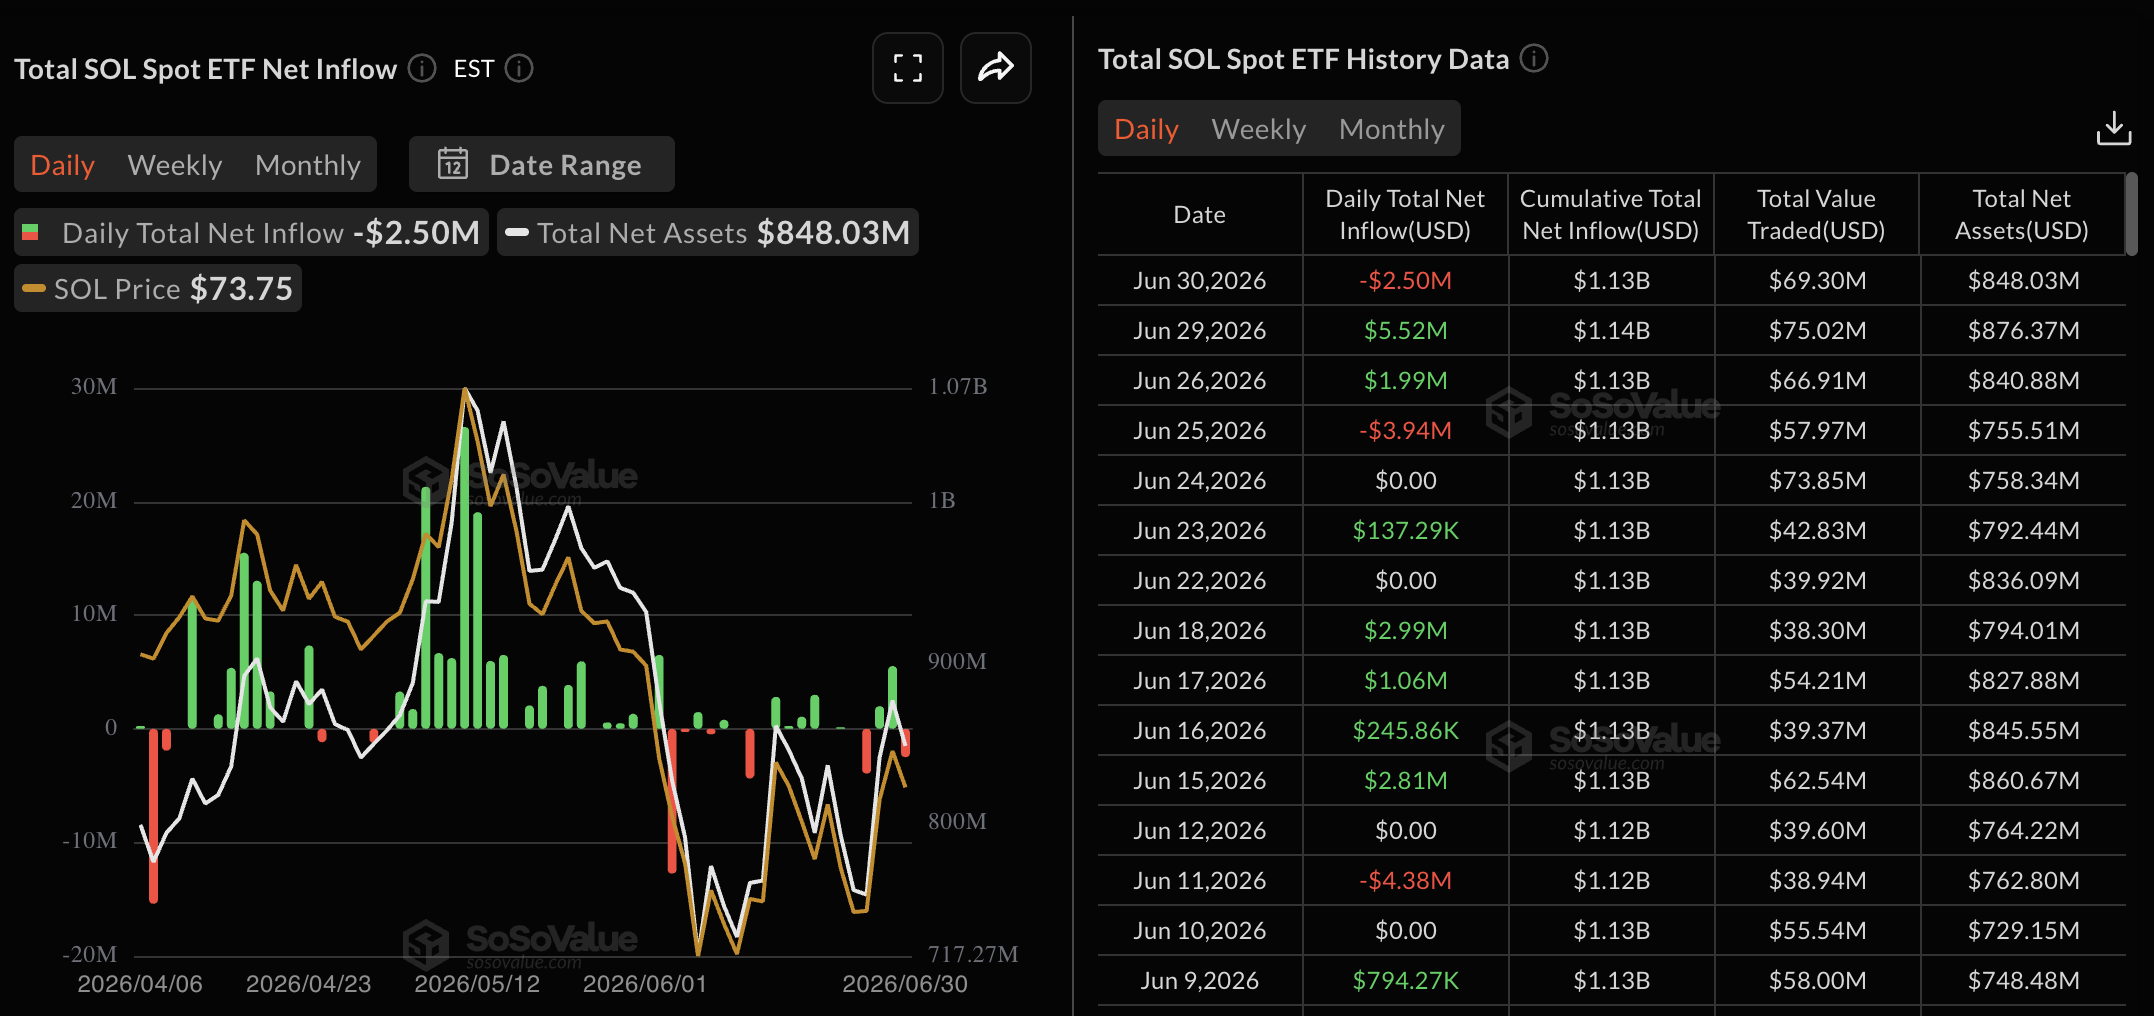
This oscillating behavior suggests institutional players are adopting a cautious approach rather than establishing firm directional bets.
Technical momentum indicators present a moderately constructive outlook. The Relative Strength Index registers at 55, slightly above neutral territory, while the MACD indicator trends toward positive ground.
Should SOL lose its grip on the 50-day EMA, market watchers anticipate a potential retreat toward the February 6 support level of $67.50. A more substantial breakdown beneath the $60 threshold would compromise the asset’s technical framework.
Trader and analyst Michaël van de Poppe shared on X that Solana’s shorter timeframe charts “actually do look good.” He outlined that a range breakout, using $77 as the critical trigger point, could catalyze an advance toward $125-$130.
His technical assessment provides another perspective for traders evaluating whether retail buying pressure can push SOL beyond current resistance barriers.
Blockchain Activity Continues Expansion
Beyond market pricing, Grayscale emphasized sustained engagement on the Solana network infrastructure. The investment firm documented approximately 1,200 transactions per second and roughly 100 million daily transactions.
Grayscale further noted 4.3 million distinct daily active users and over $100 million in transaction fees accumulated year-to-date.
The company cited Raydium, Pump.fun, and GEODNET as representative applications driving user engagement across the ecosystem.
Current trading activity near $72.76 positions the asset just above a demand zone that has historically attracted accumulation, based on blockchain analytics. This support area has maintained its integrity throughout this week’s session.
Market participants now monitor whether SOL can consolidate and advance from present levels or if downward pressure will test earlier support structures in coming trading days.