
 Stock Consolidates at $70: Key Levels That Could Trigger the Next Major Move")
Key Takeaways
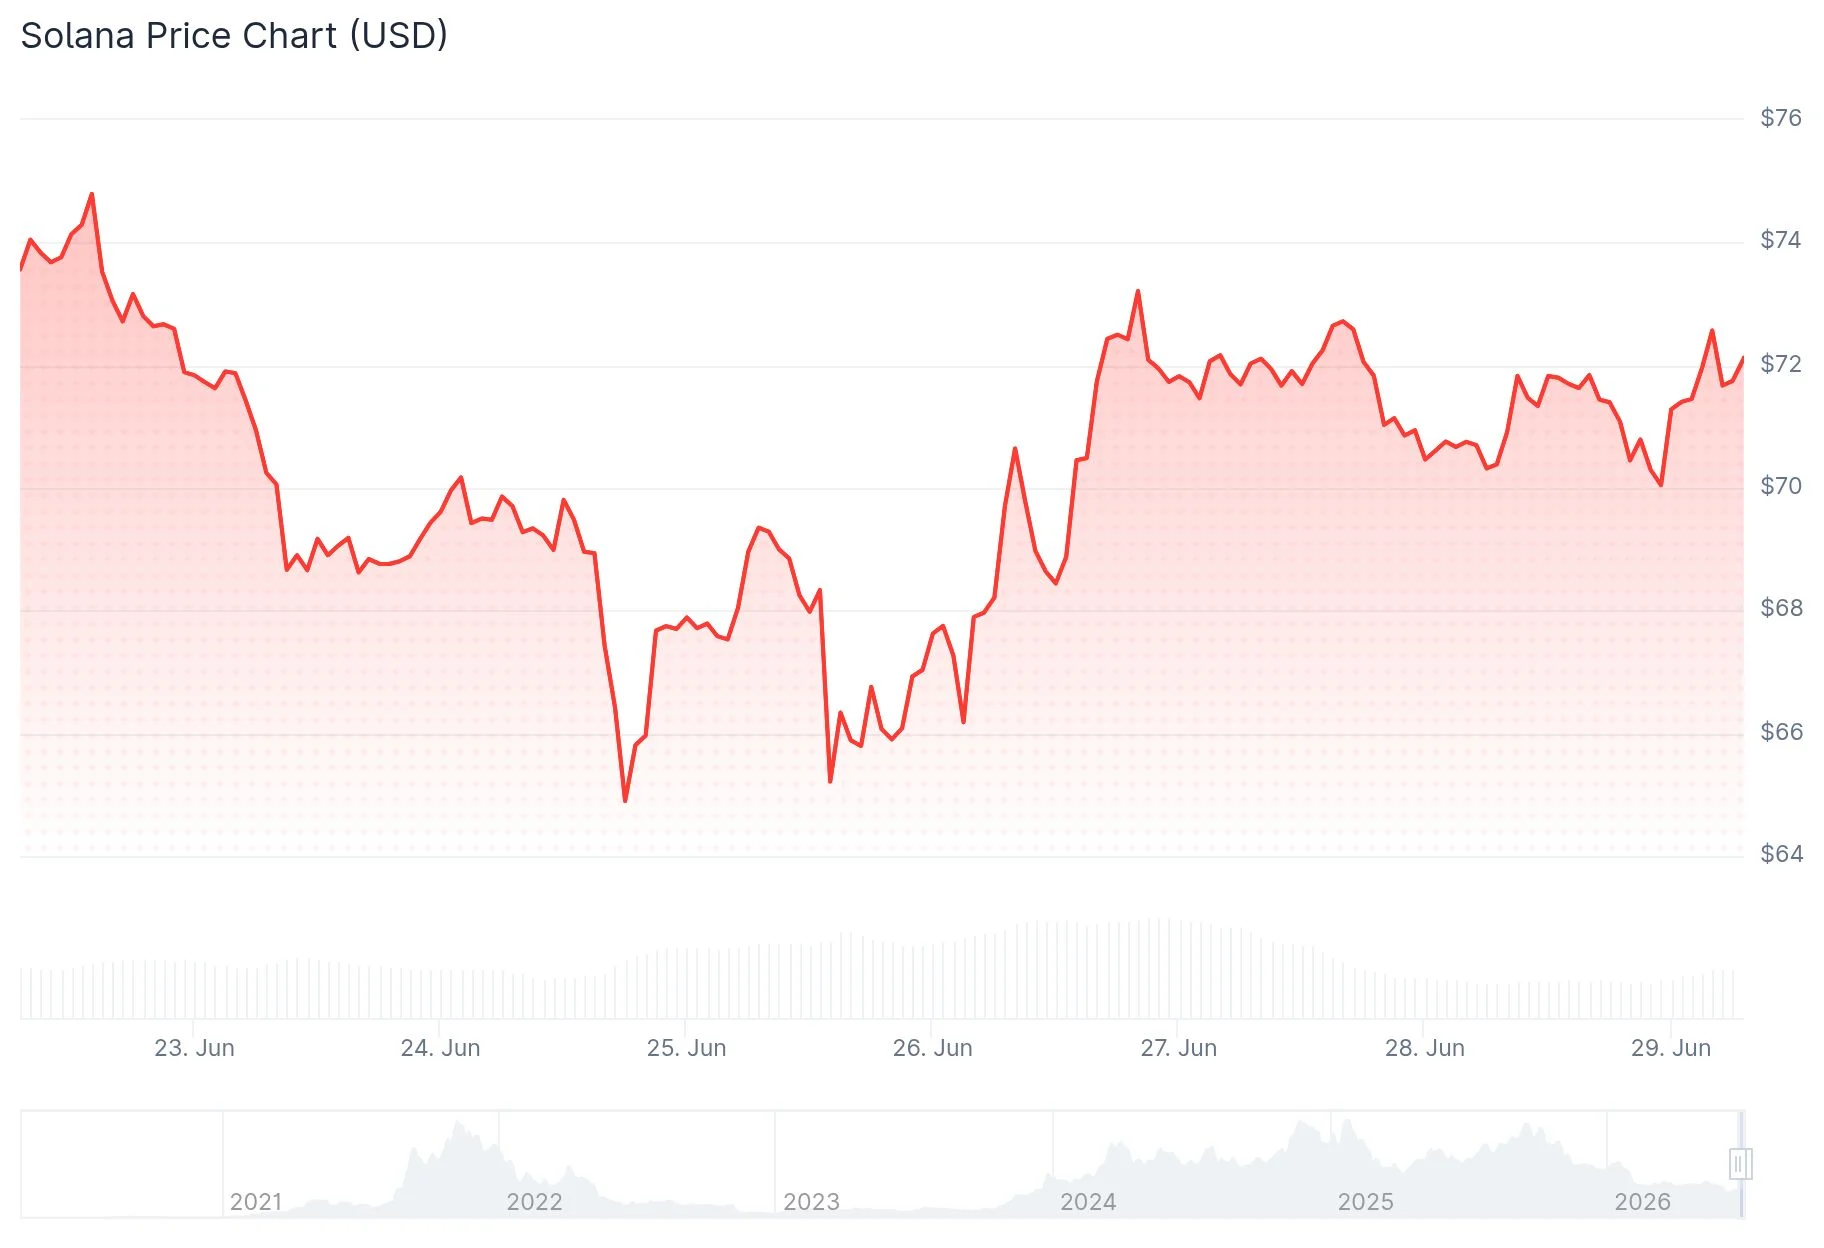
- Solana is currently hovering around $70.67, testing a critical descending resistance line
- Breaking past $80 resistance could trigger moves toward $90 and $95 price levels
- Daily trading volume for tokenized stocks on Solana reached an unprecedented $553 million
- Trader Michaël van de Poppe projects $120–$130 as achievable during Q3/Q4 2026
- Technical formations on longer timeframes indicate potential for SOL to reach $500 following decisive resistance breaks
Solana is currently positioned at approximately $70.67 as of June 29, 2026, experiencing a modest decline of roughly 1.82% over the past day. The digital asset maintains its position above the critical $70 support threshold, though market participants await stronger signals of trend confirmation from buyers.
The critical resistance zone demanding attention spans from $72 to $75. This region contains a downward-sloping trendline that represents the primary obstacle for bullish momentum to overcome.
Should SOL successfully push beyond $75, market focus will immediately shift to the $80 threshold. This represents the initial significant confirmation level that technical traders are monitoring closely.
A decisive daily close exceeding $80 would transfer short-term control to buyers and establish pathways toward the $90 and $95 regions. The $90 zone particularly aligns with notable liquidity concentrations identified on technical charts.

Conversely, failure to maintain the $70 floor could accelerate downward movement toward the $65–$60 range. A more substantial correction would reintroduce the $50 liquidity area as a viable downside target.
Trader Michaël van de Poppe shared his perspective on X, suggesting SOL appears positioned to reclaim its previous trading range. According to van de Poppe, such a move would likely encounter minimal resistance, presenting what he characterizes as a straightforward buying opportunity. His forecast includes potential price appreciation toward $120–$130 during the third or fourth quarter of the current year.
Expanding On-Chain Utility
Tokenized stock trading on Solana established a new single-day volume benchmark at $553 million. Market observer Whale Factor highlighted that Solana’s practical applications are diversifying well beyond speculative meme tokens and conventional cryptocurrency exchanges.
The real-world asset (RWA) infrastructure on Solana currently commands $3.18 billion in aggregate value across more than 291,000 unique holders, positioning it as the leading blockchain platform measured by RWA participant count.
Application revenue generated on Solana totaled $19 million during the preceding week and accumulated $85 million throughout the previous month. Decentralized exchange spot trading volume for the week registered at $12.3 billion.
Extended Timeframe Technical Formations
Technical analyst JAVONMARKS identified a cup and handle formation on the 12-day timeframe. Validation of this pattern would require a breakout above the $260–$280 resistance band accompanied by substantial trading volume, projecting upside objectives beyond $500.
Analyst Crypto Patel has outlined a strategic accumulation plan for Solana within the $40–$60 range, with profit targets established at $500 and $1,000. He draws parallels between the present price correction and the 2022–2023 accumulation phase that preceded the subsequent 2023–2024 upward movement.
An additional falling wedge configuration remains present on the broader timeframe analysis, suggesting a long-term price objective near $233 should SOL ultimately break free from this consolidation structure.
The daily chart requires a confirmed close above the descending trendline to substantiate the bullish thesis. According to analyst Dami-Defi, the weekly MACD indicator has not yet generated a bullish crossover signal.
SOL most recently changed hands at $71.44, reflecting a 0.43% decrease over the past 24 hours, according to Brave New Coin market data.