
 Stock: Can SOL Break Through the $90 Barrier This Time?")
Key Highlights
- SOL currently hovers between $88 and $90, confronting a resistance barrier that has consistently blocked upward momentum since February.
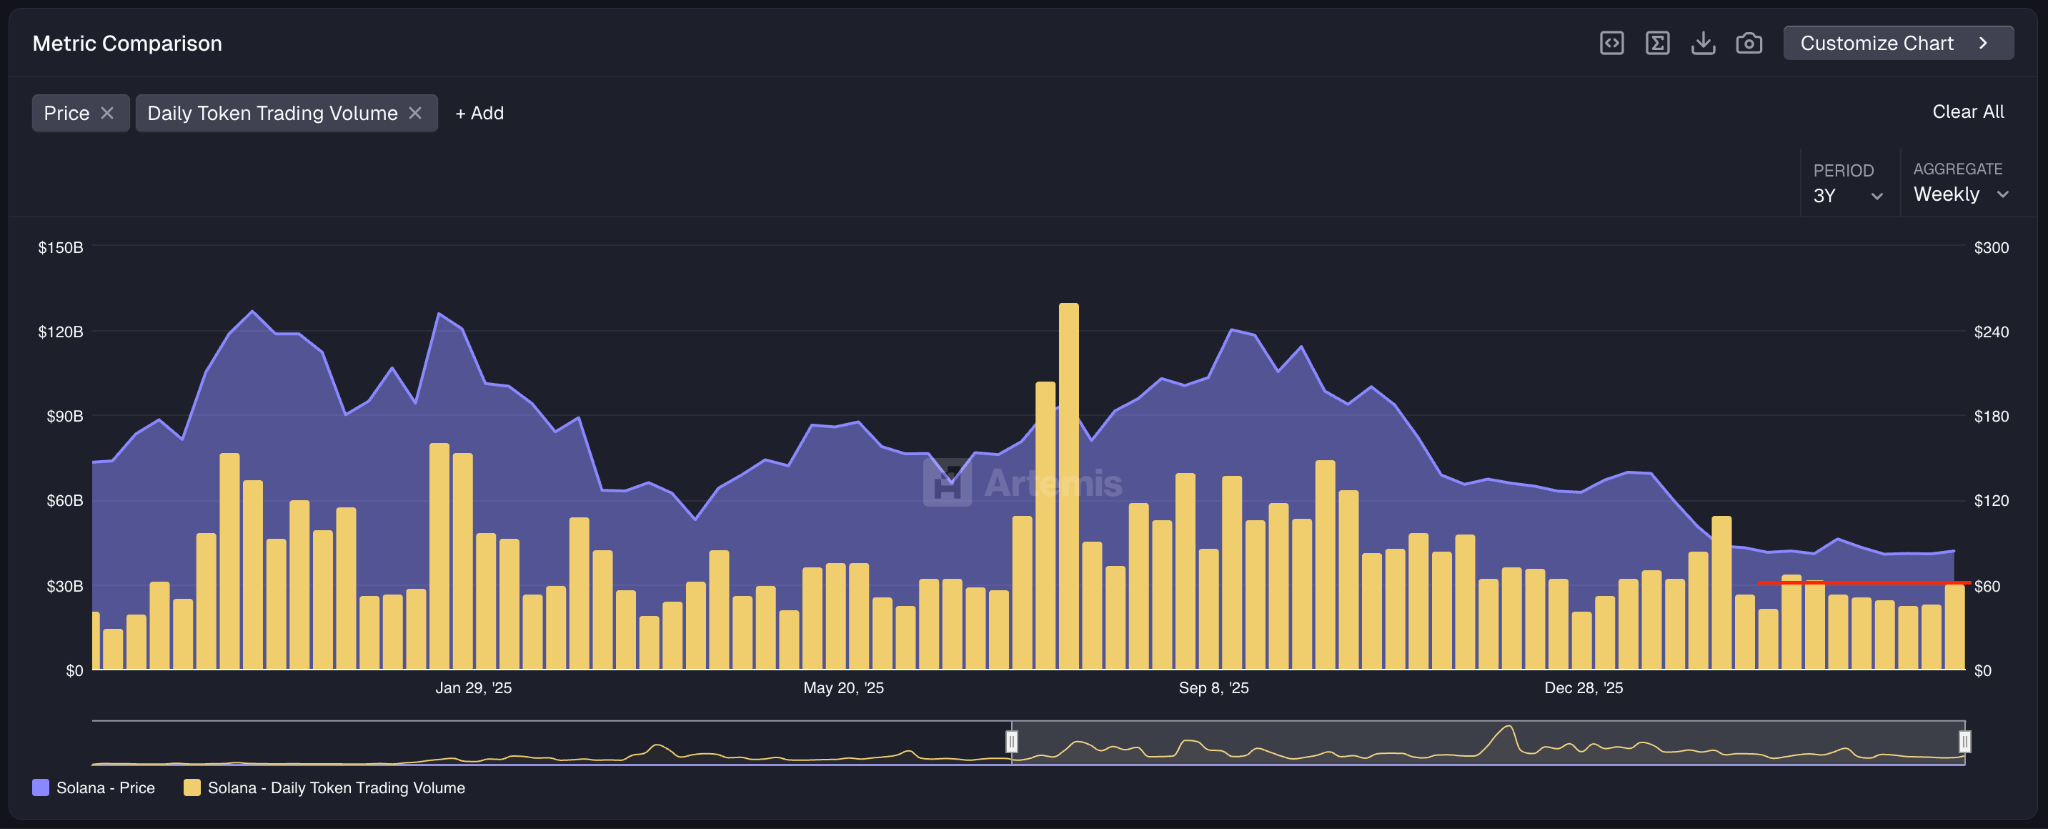
- Daily trading activity surged 35% to reach $5.3 billion, marking the strongest weekly performance since early March.
- Eight consecutive days of positive inflows into Solana ETFs brought $50 million in new capital, pushing total fund assets to $863 million.
- Successfully closing above the $95–$98 range could trigger a move toward $105–$120; a rejection might send prices retreating to $75–$77.
- Solana’s DeFi presence lags significantly, with top protocol Kamino managing less than $2 billion TVL versus Ethereum’s Aave controlling $12.8 billion.
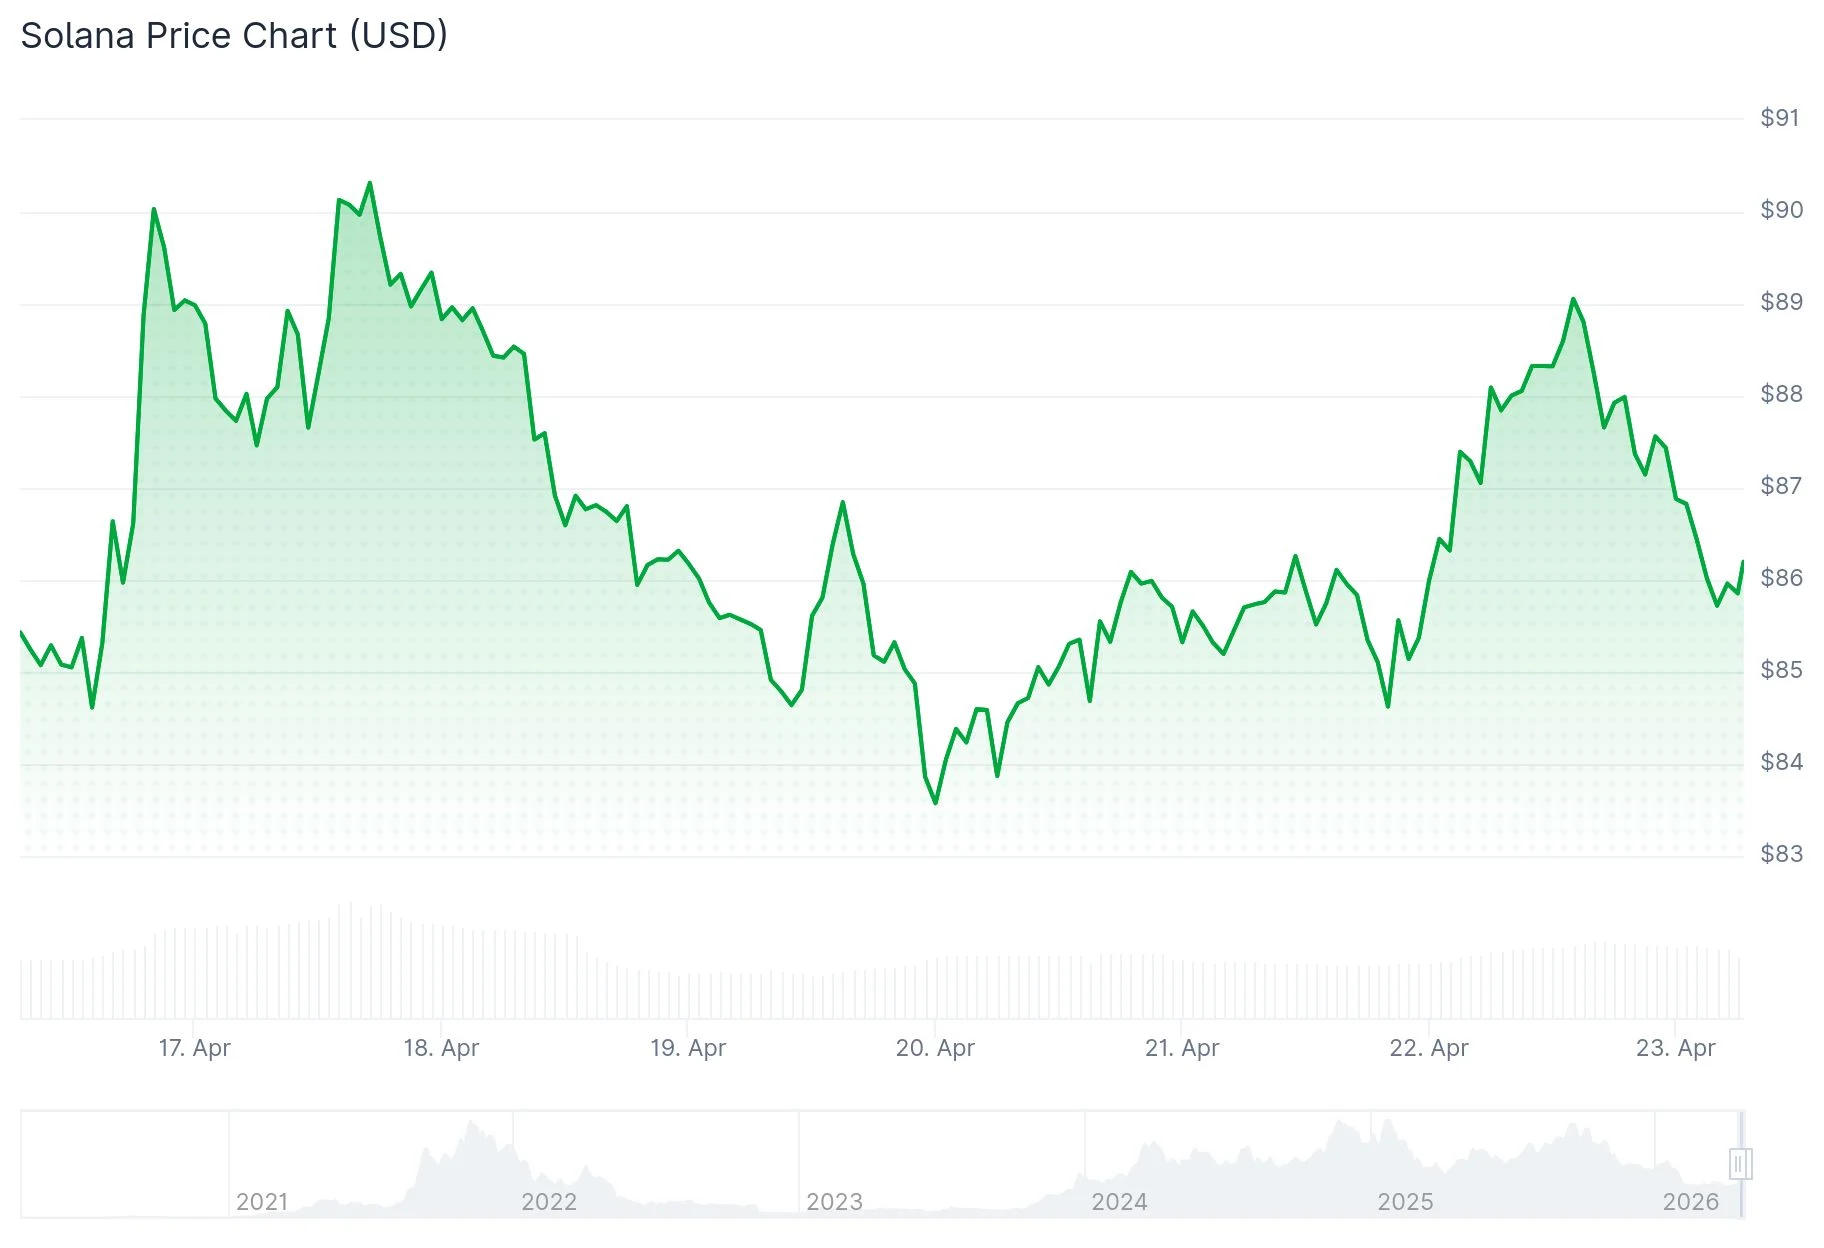
Solana (SOL) finds itself once more confronting the $90 resistance barrier, a price threshold that has consistently repelled upward attempts throughout February and beyond. Currently positioned around $88, the token has climbed approximately 2.5% over the past day, following an earlier peak of $94.21 during this cycle before experiencing a pullback exceeding 5%.
Over the previous 30-day period, SOL has declined roughly 2.4% while both Bitcoin and Ethereum registered gains near 12%. This performance divergence has captured the attention of market participants and technical analysts eager to determine whether this latest test will yield different results.
Market activity has intensified notably. Daily trading volume expanded 35% to hit $5.3 billion, representing approximately 11% of SOL’s circulating market capitalization. Data compiled by Artemis indicates that the previous week’s trading volumes reached their highest levels since the beginning of March.
The $88–$90 supply zone has repeatedly acted as a ceiling for SOL. During each encounter, purchasing pressure has driven prices into this region only to meet substantial selling resistance. Market analysts identify resistance clusters concentrated between $86 and $89, with confirmation of a legitimate breakout requiring a daily candle close beyond $95–$98 accompanied by robust volume.

On the encouraging side, Solana exchange-traded funds have registered consecutive positive inflows spanning eight trading days. Combined inflows during this period totaled $50 million, elevating aggregate fund holdings to $863 million. This persistent institutional-style accumulation suggests that demand for SOL exposure remains active.
Chart Analysis
Market analyst Lucky, sharing insights on X, presented technical charts illustrating SOL confined within a descending channel pattern while simultaneously pressing against overhead resistance barriers. The charting also identifies a demand zone anchored at $67.73. Lucky observed that a prior breakout from a comparable formation generated substantial upward movement and suggests a similar pattern may currently be developing at an expanded scale.
Analyst MCO Global DE presents an alternative interpretation, contending that the present rebound remains corrective in nature and that the five-wave declining structure stays valid beneath $89. Two contrasting perspectives on the same price action.
The Relative Strength Index is advancing toward the mid-50s range — accumulating momentum without entering overbought territory. The MACD indicator is similarly rotating positive, signaling a gradual transition toward buying dominance. Traders Union has projected a price target near $87.84 within the coming week, suggesting expectations of ongoing consolidation rather than an immediate breakout scenario.
Should SOL successfully breach and maintain levels above $95–$98, technical strategists highlight an initial advance toward the $105–$120 zone. One technical assessment estimates potential upside at 36% from present levels if momentum extends toward the 200-day exponential moving average. More ambitious projections identify targets near $253 on extended breakout charts contingent upon favorable broader market conditions.
Critical support resides at $82–$83, with additional support layers positioned at $80.50 and $77.20. The demand zone foundation at $67.73 represents a crucial level that bullish participants must defend.
DeFi Ecosystem Challenges
One element creating headwinds for Solana relative to Ethereum involves its decentralized finance landscape. Kamino, representing Solana’s largest DeFi protocol, maintains less than $2 billion in total value locked. By comparison, Ethereum’s Aave protocol alone commands $12.8 billion. Infrastructure metrics also favor Ethereum, which operates 912,000 validator nodes against Solana’s 777 active validators.
The meme token sector, an area where Solana-based platforms such as Pump.fun achieved dominance, has experienced cooling momentum throughout the past six months.
Recovery in open interest approaching $6 billion alongside stablecoin network volume expansion represent the two primary confirmation signals market participants are monitoring heading into subsequent trading sessions.