
 Stock Battles Critical $84 Resistance as Network Surpasses $1 Trillion Milestone")
Key Highlights
- SOL confronts a critical resistance barrier between $84 and $87, with crucial support established in the $78–$82 range
- Technical analysts identify a weekly broadening pattern suggesting potential upside to $1,000 upon confirmation
- The network achieved a groundbreaking milestone with $1.1 trillion in economic throughput during Q1 2026
- User engagement surged to 5.5–5.8 million active addresses, significantly exceeding the 3–4 million average from late 2025
- Transfer activity exploded to $75 billion while token valuation remains relatively subdued
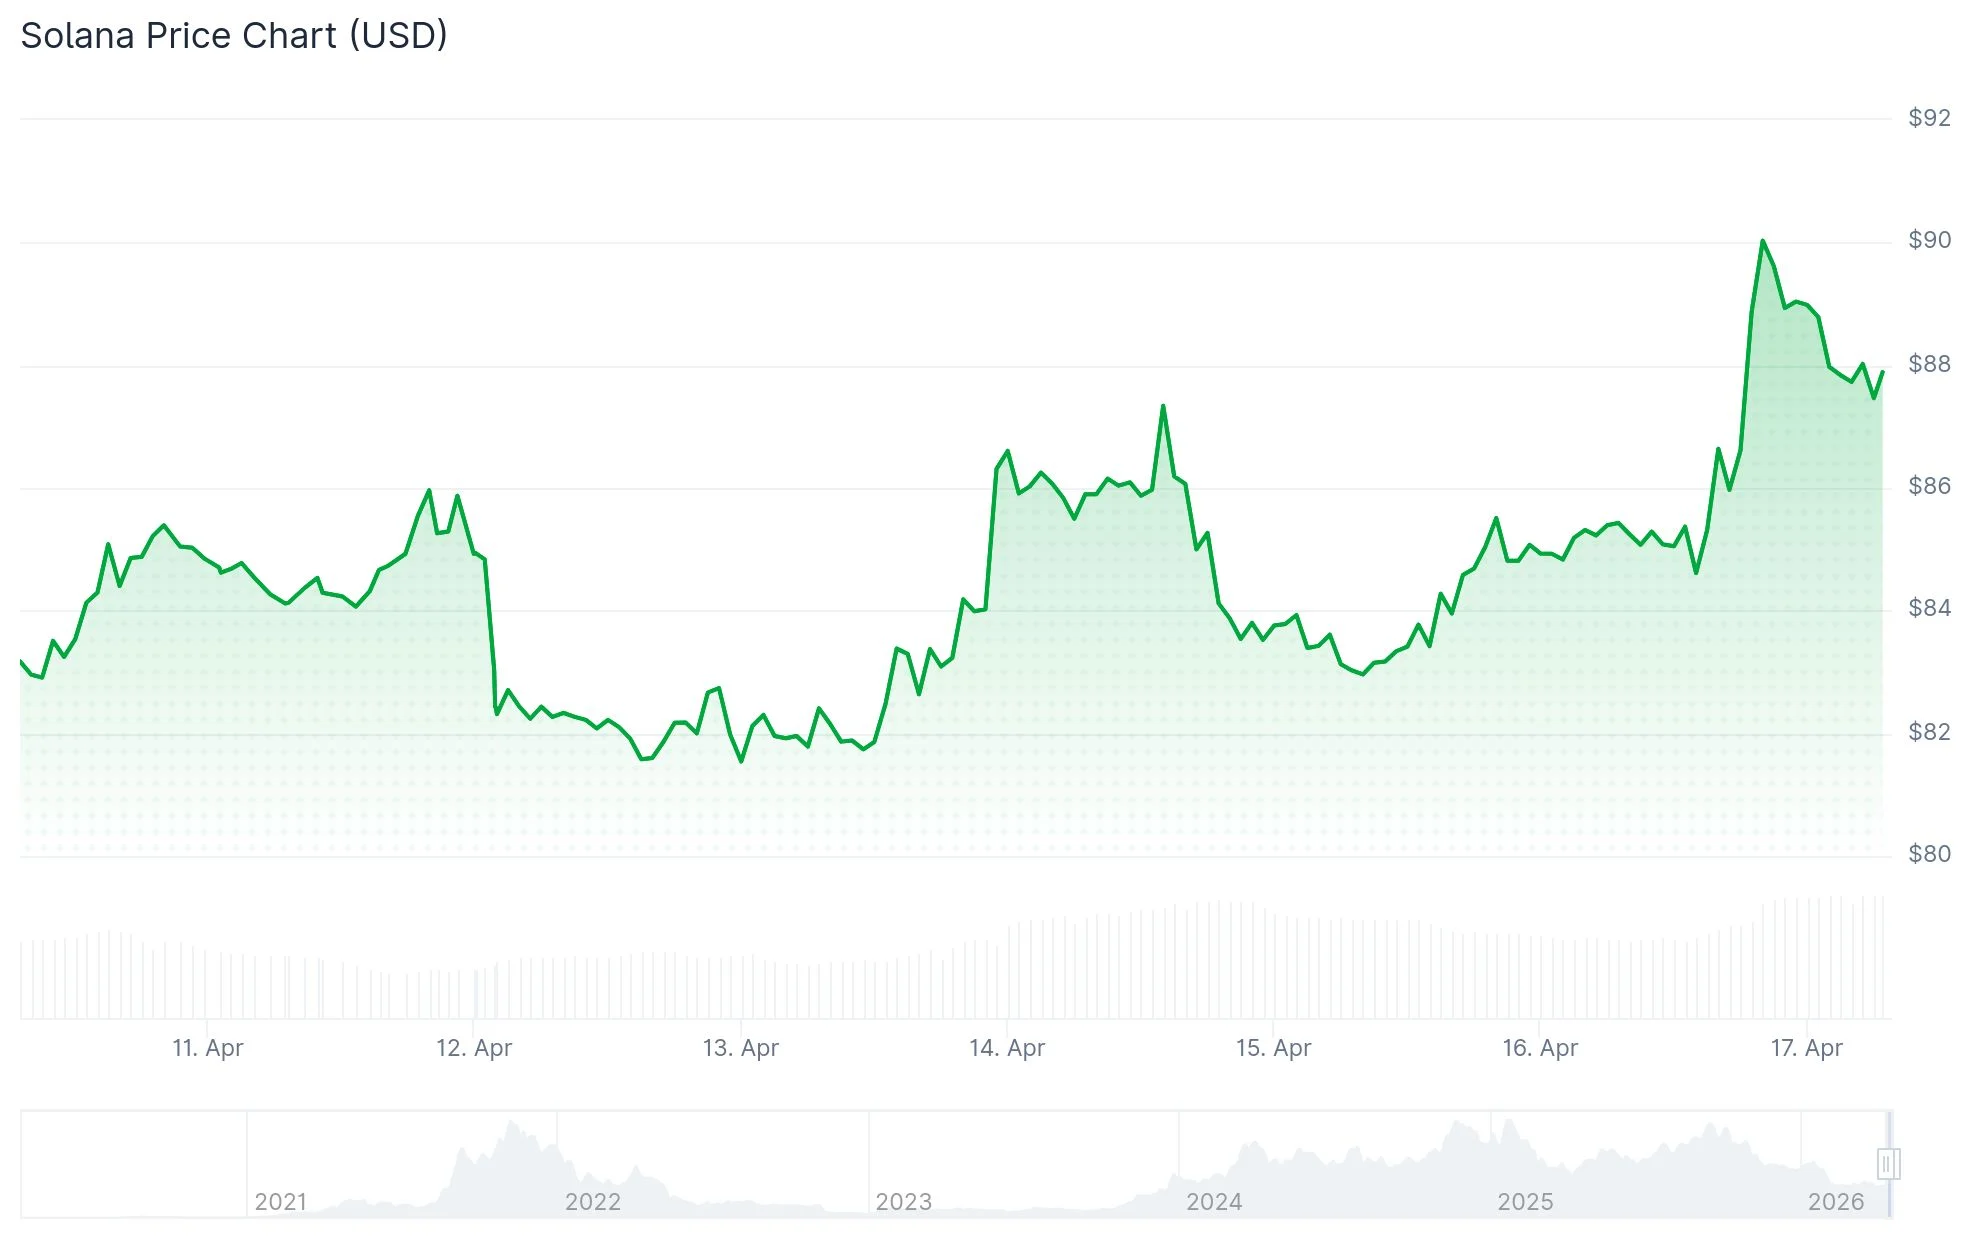
Solana currently finds itself at a pivotal technical juncture. Examining the 1-hour chart reveals SOL challenging a resistance barrier around the $84 level following a rebound from the $78–$81 support range.
Multiple Fibonacci retracement levels converge within this territory — specifically at $84.46, $85.06, $85.56, $86.51, and $87.03. This concentration forms a formidable overhead supply zone that could prove challenging to penetrate in one decisive move.
Should SOL encounter rejection at this cluster, a pullback toward the $81.65–$78 support region becomes probable. Conversely, a successful breach above this resistance unlocks potential advancement toward the $87–$88 zone.
Examining the weekly timeframe, technical analyst CryptoCurb has identified a broadening megaphone formation on X. This pattern demonstrates multiple contact points along both the upper trendline resistance and lower trendline support throughout several price oscillations.

The pattern’s lower boundary continues to function as reliable support. Preservation of this zone maintains the constructive technical setup. CryptoCurb’s ambitious projection indicates a potential objective exceeding $1,000 following a validated breakout — though this represents a prospective scenario rather than an established outcome.
Blockchain Metrics Reach Unprecedented Levels
Beyond technical price analysis, Solana’s fundamental blockchain metrics demonstrate exceptional strength. According to Artemis analytics, the network processed $1.1 trillion in aggregate economic activity throughout Q1 2026, marking Solana’s inaugural trillion-dollar quarter.
To provide perspective, Q3 2025 registered approximately $600 billion while Q4 2025 reached roughly $850 billion. This represents a substantial quarter-over-quarter expansion of nearly 29%.
Network participation metrics show active addresses operating at 5.5–5.8 million, representing a significant increase from the 3–4 million baseline observed throughout late 2025. Address activity even momentarily peaked between 6.5–7 million during the early portion of Q1.
Solana dominated all major blockchain networks in Q1 2026 by transaction throughput, executing 25.3 billion transactions across the three-month period.
On-Chain Value Transfer Accelerates
Daily transfer volumes, which predominantly fluctuated between $5 and $15 billion during late 2025, recently accelerated toward the $70–$75 billion territory.
The PreStocks decentralized exchange operating on Solana additionally established a single-day volume benchmark of $28.65 million.
Despite this substantial on-chain activity, SOL’s market valuation has not yet absorbed the fundamental network expansion. Capital circulation is intensifying, but corresponding price appreciation remains pending.
SOL’s current market behavior shows the asset challenging resistance around $84, with the $78–$81 zone serving as the critical foundation that must hold.