
 Stock Approaches Critical $100 Threshold Amid Technical Compression")
Key Highlights
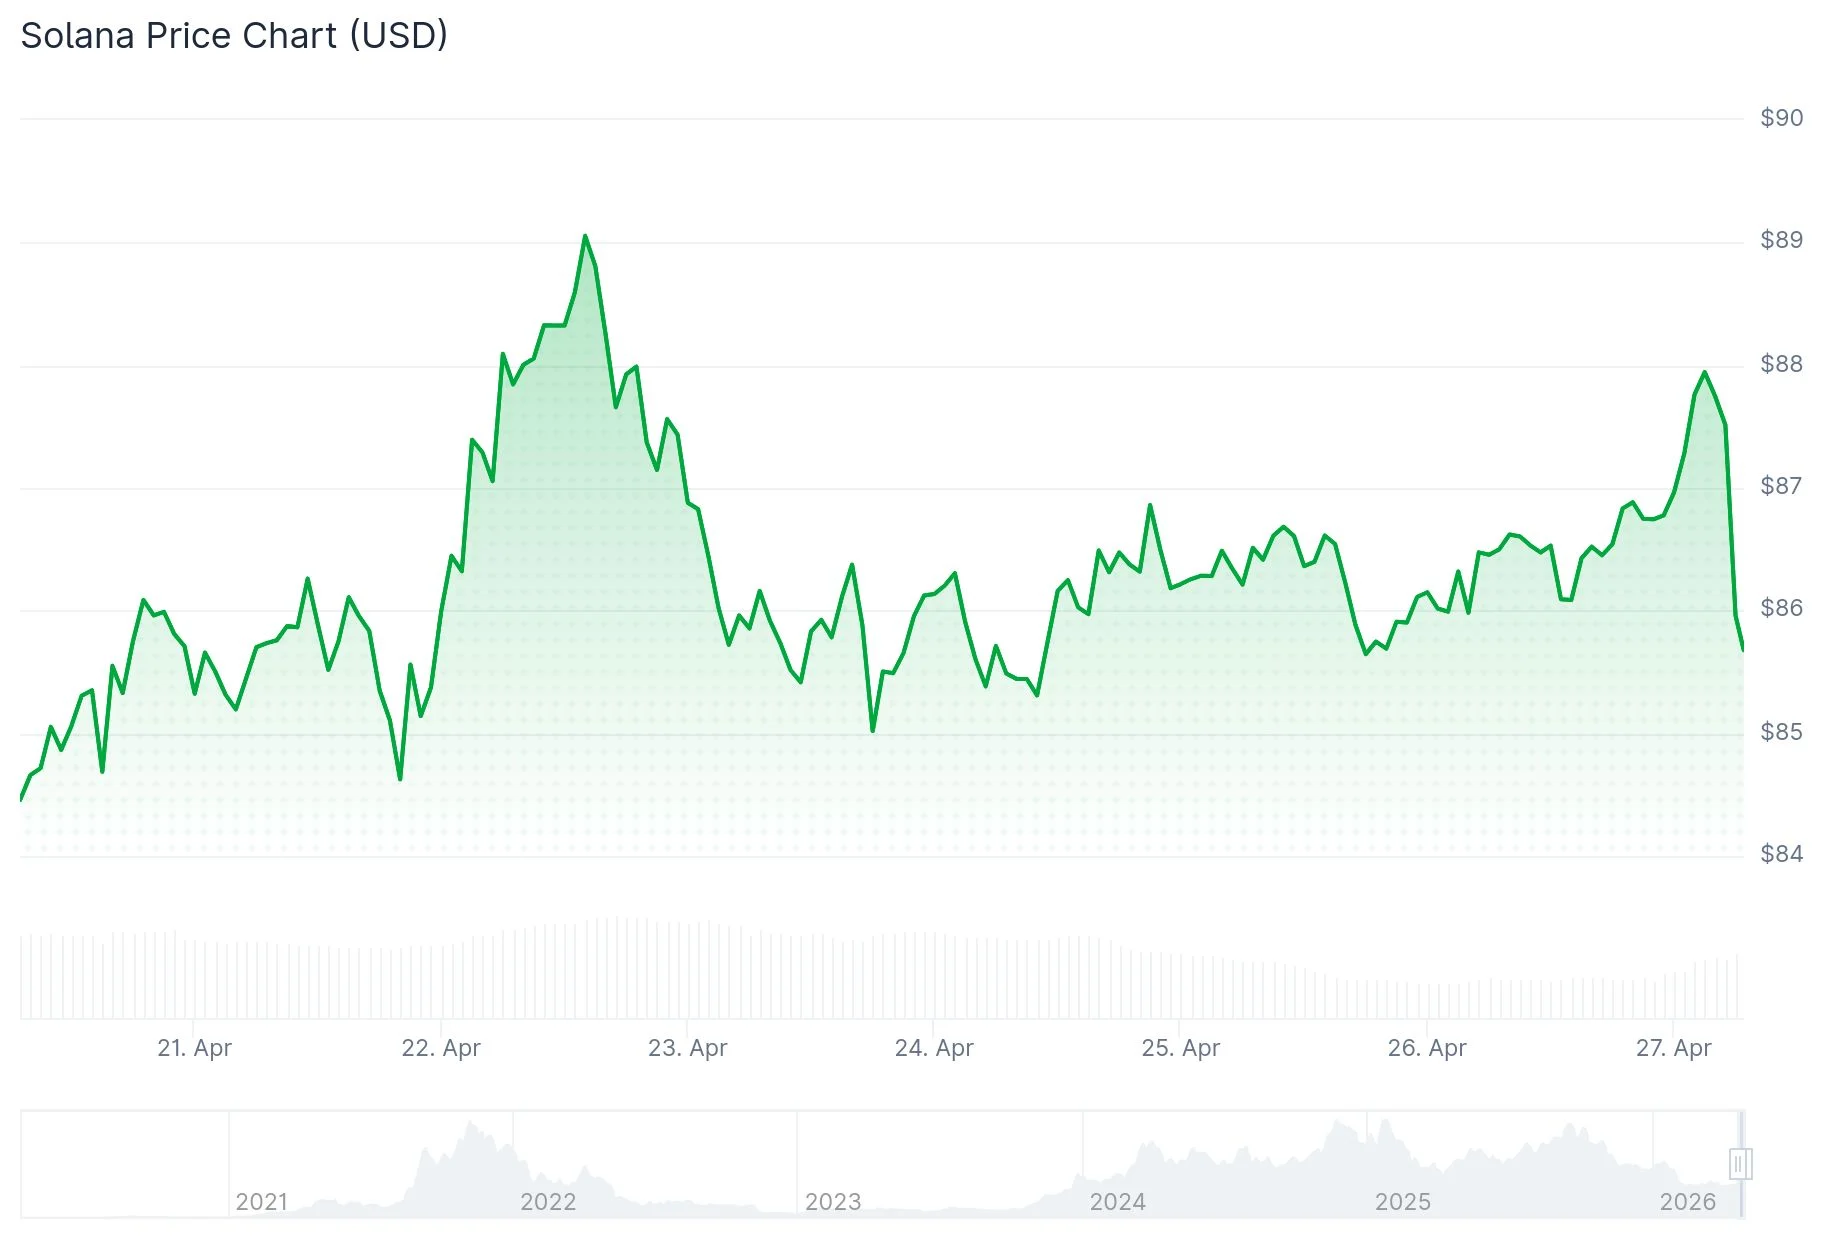
- SOL maintains position around $87–$88, supported by its 50-day EMA, facing critical resistance between $90–$94
- Crypto analyst Ali Martinez identified a compressed Bollinger Band formation spanning $77 to $94 on the 3-day timeframe
- Solana-focused ETFs attracted $9.44 million in weekly net capital, extending a five-day inflow streak to approximately $1.45 billion
- Goldman Sachs revealed holdings worth roughly $108 million in Solana
- A decisive breakout above $94 could trigger momentum toward $100; failure below $77 may initiate deeper declines
Solana (SOL) is currently positioned near $87–$88 on Monday’s session, maintaining its stance above the 50-day Exponential Moving Average (EMA) anchored at $87.04. Following a bounce from recent lows around $84.55, the digital asset is now confronting a pivotal resistance area.
The cryptocurrency has climbed past the 50% Fibonacci retracement marker derived from its latest decline spanning $89.34 down to $84.55. Technical analysts have identified an ascending trendline providing support around $86.50 on shorter timeframes.
Immediate overhead pressure emerges at $88.20, corresponding with the 76.4% Fibonacci retracement zone. Beyond this level, additional barriers appear at $90 and subsequently at $92.
Market analyst Ali Martinez drew attention to SOL’s position within a constricted Bollinger Band channel on the 3-day chart, bounded by $77 at the lower end and $94 at the upper extreme. Martinez characterized this territory as a “no-trade zone,” cautioning that attempting to capitalize on movements within this range frequently results in erratic losses. According to his analysis, a confirmed 3-day candle closure beyond these parameters is essential before interpreting any directional shift as a genuine breakout signal.

Trading volume has contracted by more than 23% throughout this consolidation period. While diminished volume during lateral price movement is typical market behavior, any advance beyond $94 would require substantially increased participation to validate a push toward the $100 milestone.
Momentum Indicators Show Emerging Bullish Bias
The Relative Strength Index (RSI) currently registers at 55, climbing above the neutral threshold on daily charts. Meanwhile, the MACD histogram and signal line have crossed into positive territory, signaling that purchasing pressure has gained the upper hand.
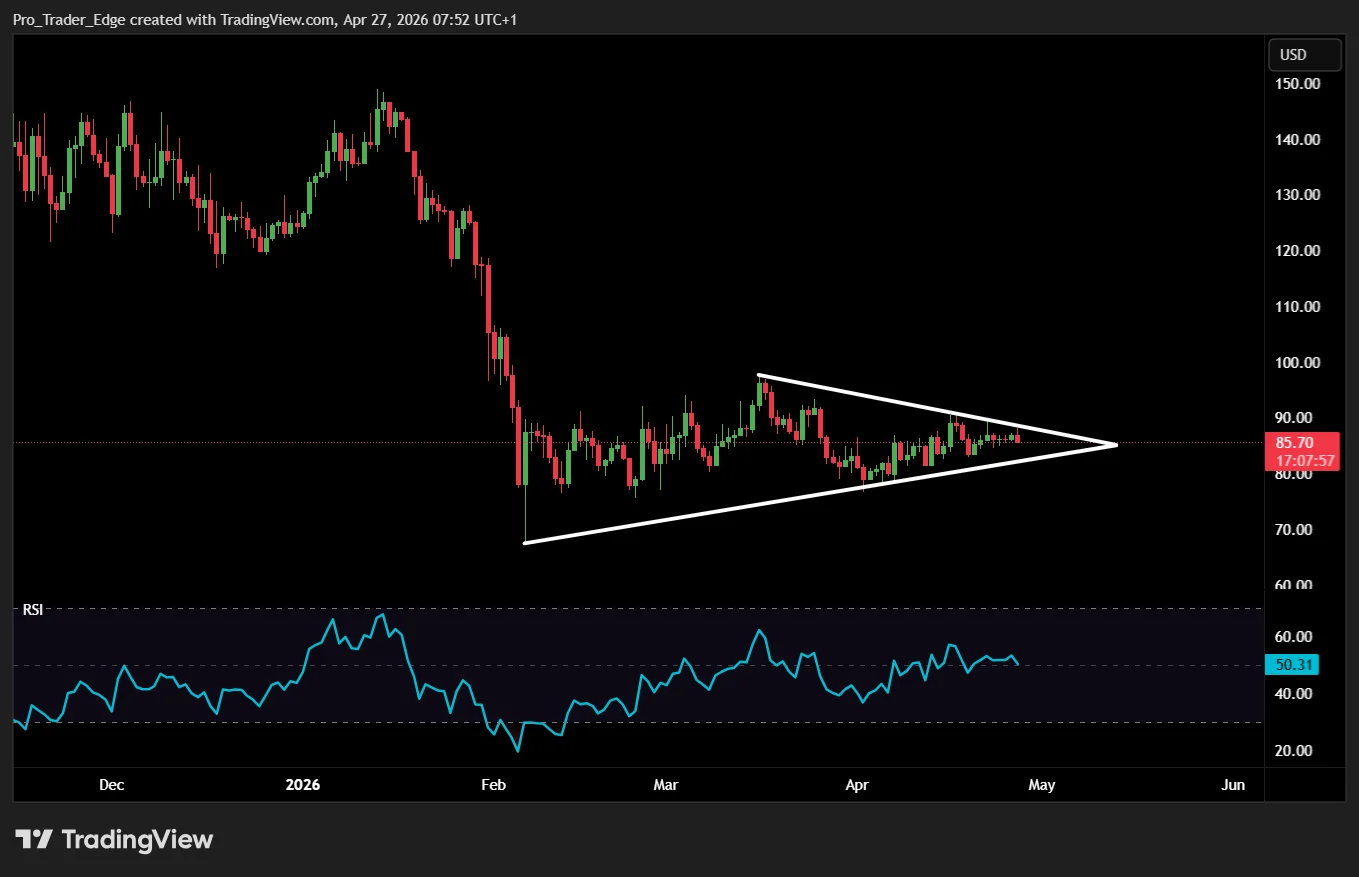
SOL is testing the upper boundary of a symmetrical triangle formation near $89.00 on the daily timeframe. A confirmed break above this technical structure would bring the psychologically significant $100 level into view, followed by the 200-day EMA positioned at $113.
Regarding downside risk, the 50-day EMA at $87.04 represents the initial support layer. A daily candle closing beneath the ascending trendline near $85.99 would compromise the current constructive technical framework.
Institutional Capital Flow and Exchange-Traded Product Momentum
Exchange-traded products focused on Solana captured $9.44 million in net weekly capital inflows, following the previous week’s $35.17 million. An unbroken streak of five consecutive trading sessions with positive inflows has accumulated approximately $1.45 billion in aggregate.
Investment banking giant Goldman Sachs has disclosed exposure totaling nearly $108 million in Solana, contributing another significant institutional data point to the evolving narrative around institutional adoption.
SOL futures Open Interest expanded by over 2% within a 24-hour window to reach $5.23 billion. The funding rate jumped to 0.0095%, reflecting that derivatives traders are willing to pay elevated premiums for maintaining long exposure.
Should SOL prove unable to penetrate the $90–$94 resistance cluster, immediate downside support levels emerge at $86.50, followed by $85. A decisive close beneath $78 could accelerate selling pressure toward the $72 region.