
 Stock: Analyst Highlights $45–$75 Entry Window Amid Record ETF Withdrawals")
Key Takeaways
- Solana climbed more than 2% on Monday following a consecutive four-day decline that resulted in a 5% weekly loss.
- Spot Solana ETFs in the United States saw $7.84 million in withdrawals on Friday, marking the fourth-highest single-day outflow since launch.
- SOL derivatives witnessed liquidations exceeding $22.98 million within 24 hours, with long contracts comprising $19.18 million of the total.
- Funding rates shifted into negative territory at -0.0141%, indicating traders are compensating others to maintain short exposure.
- Critical support is identified near $70–$75, with market watchers anticipating a potential decline toward $50 should this level fail.
Solana is attempting to stage a comeback following a challenging week, yet underlying market data paints a more reserved picture. Significant ETF withdrawals, substantial liquidation events, and pessimistic derivatives metrics all hint that the current rebound could be fleeting.
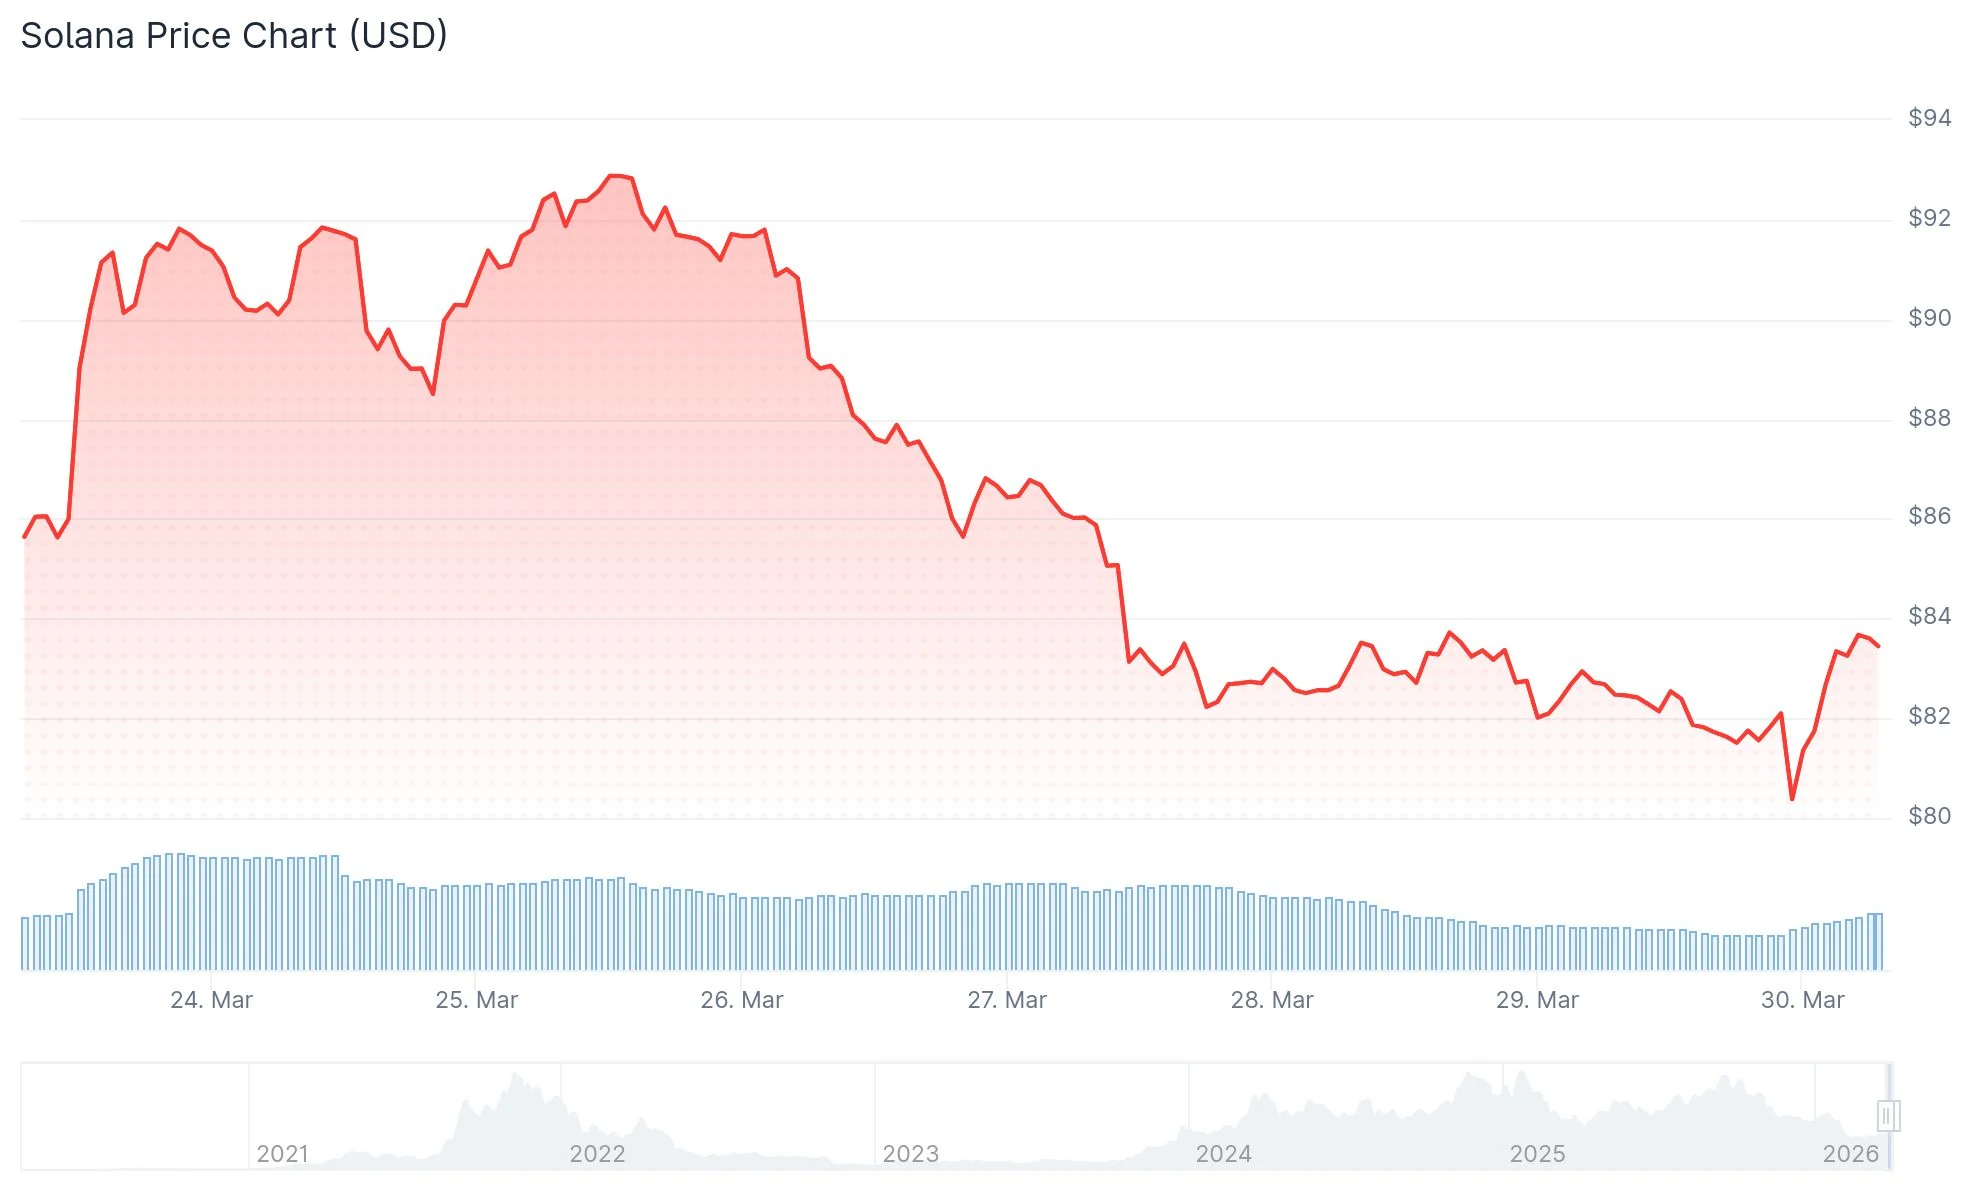
Solana concluded the previous week with approximately a 5% decline, bottoming just above the $81 mark before posting gains exceeding 2% on Monday. The asset breached a rising trendline near $88 that had been providing support, a development many chart watchers interpreted as a significant shift in momentum.
The 50-day, 100-day, and 200-day Exponential Moving Averages (EMAs) are all positioned above current trading levels, reinforcing the bearish technical setup. For SOL to begin reversing this negative configuration, it would require a sustained daily close above the $91 threshold.
The MACD indicator has descended below its signal line and entered negative territory. Meanwhile, the RSI hovers at 42, beneath the neutral 50 benchmark, indicating that selling pressure remains dominant in the market.

Spot Solana ETFs in the United States experienced $7.84 million in net withdrawals on Friday alone. This represented the fourth-largest single-day outflow since these investment vehicles debuted, and it completed a third straight week of negative net flows.

Should institutional withdrawals persist throughout the current week, additional downward pressure would likely compound an already vulnerable price structure.
In the derivatives marketplace, $22.98 million worth of SOL contracts were liquidated over the past 24-hour period. The overwhelming majority—$19.18 million—stemmed from long positions being forcibly closed.
The negative funding rate of -0.0141% demonstrates that market participants are accepting costs to maintain short positions, providing a clear signal of prevailing bearish sentiment.
Analysts Identify $70–$75 as Critical Support Region
Analyst Crypto Patel shared a two-week timeframe chart illustrating that SOL has declined approximately 77% from its all-time peak near $250. His technical analysis identifies a crucial support and potential entry zone spanning $45 to $75, with a Fibonacci retracement level at $52.11 representing a deeper downside target.
Patel observed that bullish enthusiasm was widespread when Solana traded above $250, yet has notably diminished with prices below $80. He interprets the current weakness as a possible accumulation opportunity for investors with extended time horizons, projecting eventual targets of $500 and $1,000.
A complementary analysis from More Crypto Online utilized a one-hour chart framework to demonstrate that Solana had violated a near-term ascending trendline. This technical perspective characterized the breakdown as a potential “wave 3” downward movement, targeting a support corridor between $71.91 and $77.91.
Current Technical Picture
Near-term support rests at the recent trough of $81.44. A breakdown beneath this level would expose $75.63, the February 24 low that initiated the previous uptrend.
Resistance overhead is concentrated between $84.85 and $87.71, with the 50-day EMA at $91.24 representing a more substantial obstacle.
SOL ETF movements are under intense scrutiny, with Friday’s $7.84 million outflow providing the most tangible evidence yet of institutional caution.