
 Stock: $110M Exchange Influx Signals Potential Further Decline Ahead")
Key Takeaways
- Approximately 1.40 million SOL tokens worth roughly $110 million have been deposited to cryptocurrency exchanges over a 72-hour period.
- A bear flag formation has been breached on SOL’s daily chart, with a critical structural level near $85 now lost.
- Immediate support is holding at $77, while a breakdown could push prices toward the $66–$70 range.
- The 4-hour timeframe shows a bearish SMA crossover (SMA-20 crossing beneath SMA-50), indicating deteriorating momentum.
- Network fundamentals remain strong with real-world asset tokenization exceeding $2 billion and SoFi’s new enterprise banking platform launching on Solana.
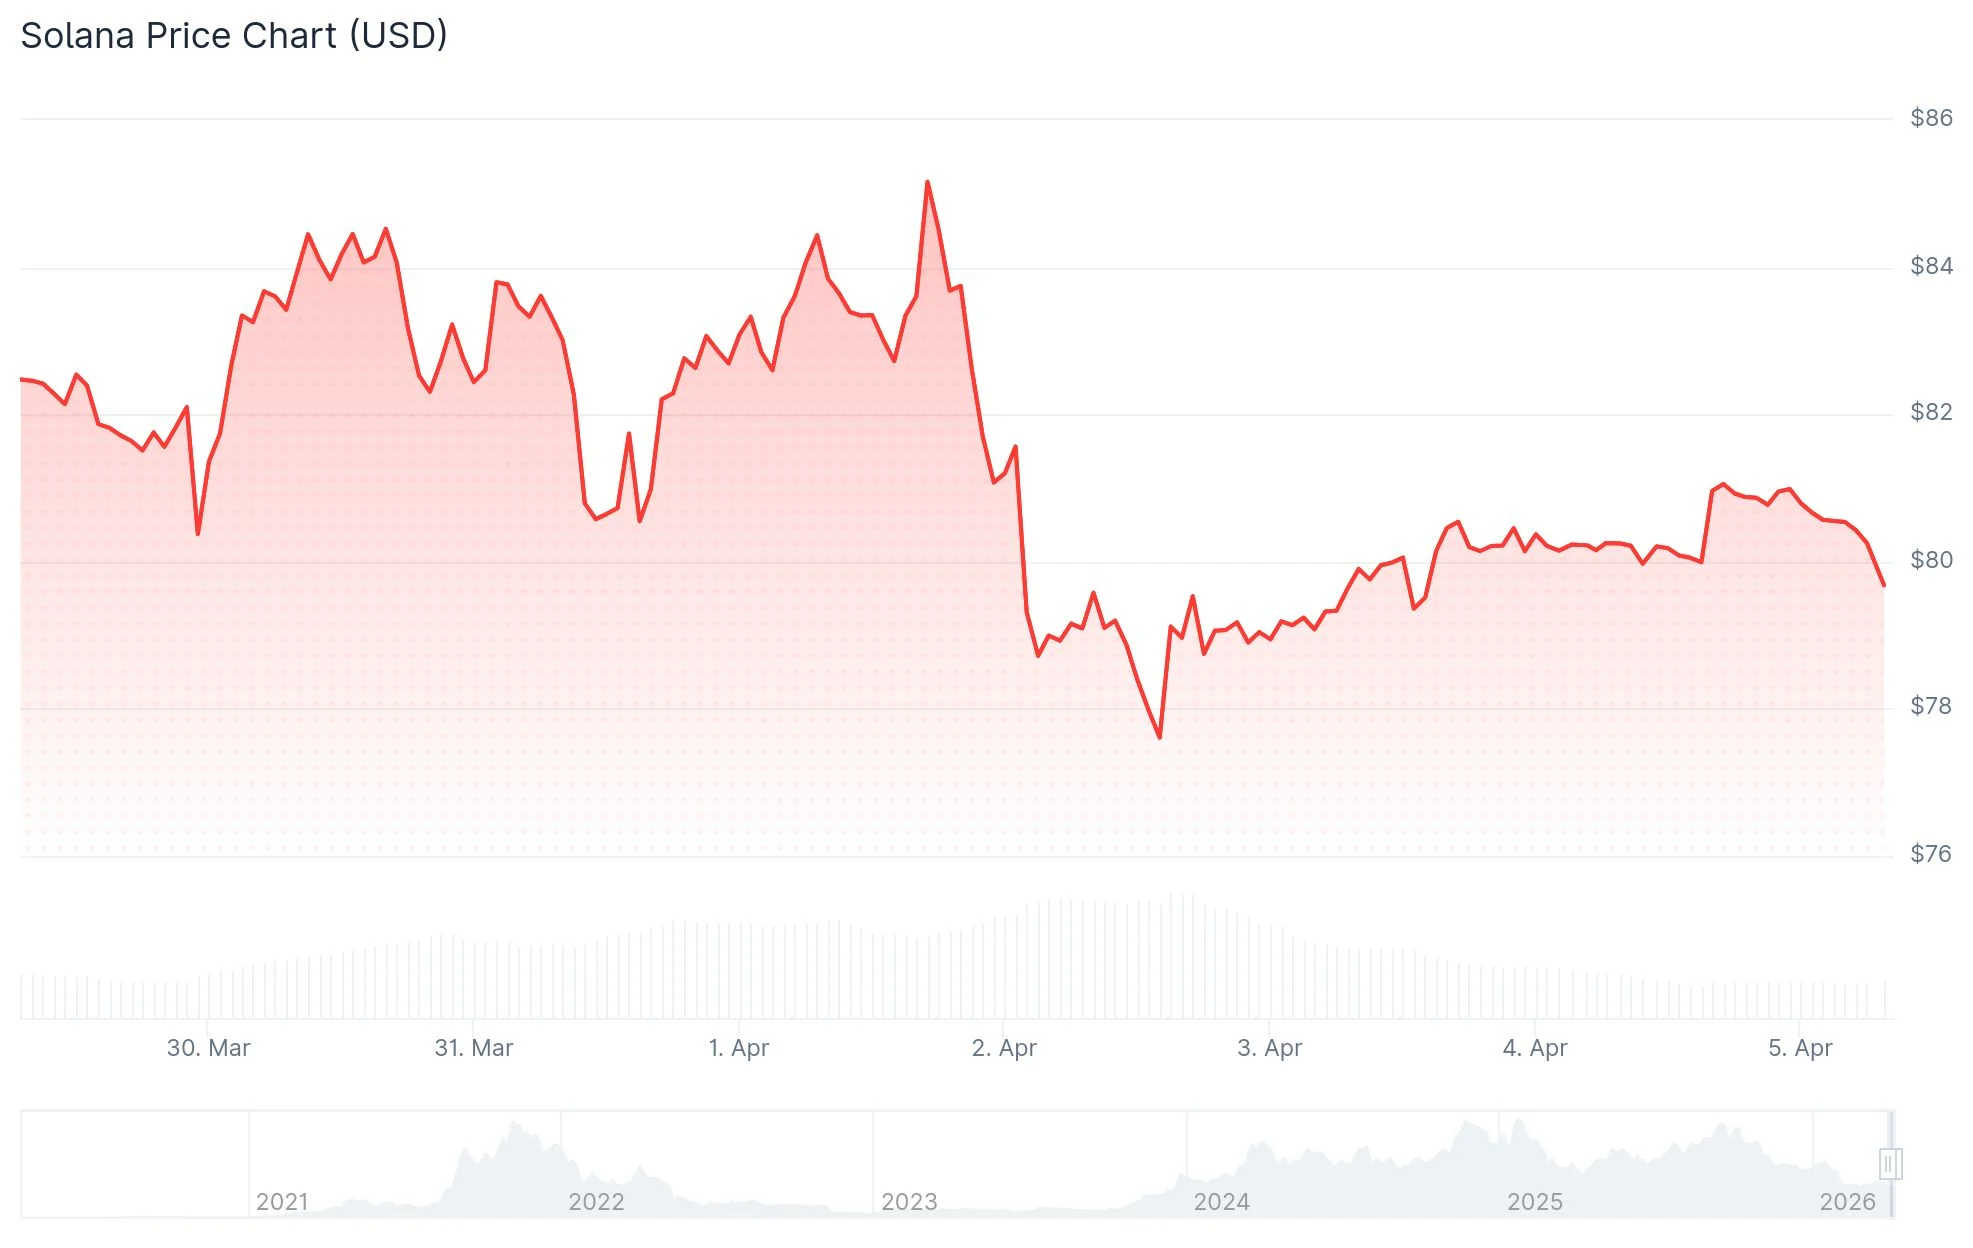
Solana (SOL) is experiencing heightened downward pressure following substantial token transfers to centralized exchanges, compounding an already fragile technical environment. The cryptocurrency is currently changing hands between $79 and $81, representing approximately a 2.95% decline over the last seven days.
Blockchain analytics expert Ali Martinez reported that roughly 1.40 million SOL tokens were transferred to cryptocurrency exchanges during a three-day span. This movement represents approximately $110 million in digital assets now positioned on trading venues. Significant exchange deposits are typically interpreted as an indicator that token holders may be positioning to liquidate their holdings.
The chart analysis reinforces bearish sentiment. Market analyst Crypto_Scient identified a breakdown from a bear flag pattern on the daily timeframe, with price action surrendering the market structure pivot around $85. This threshold had previously separated bullish from bearish control, and its violation has created a pathway toward lower price targets.
Additionally, a bearish moving average crossover has materialized on the 4-hour chart, where the 20-period simple moving average has dipped below the 50-period simple moving average. This technical development has historically preceded continued downward movement. Price is currently positioned beneath an established supply zone, with the market accepting these diminished valuations.

Critical Support Zones Under Watch
Near-term demand has been concentrated around the $77 level, which has functioned as a temporary floor during recent trading. Should this threshold fail to hold, technical analysts are eyeing secondary support in the $63–$67 corridor.
Market commentator Marcus Corvinus observed that the $92–$95 range had previously served as a robust defensive zone, but selling pressure overwhelmed buyers in that area, driving SOL into the $75–$78 territory. He characterized this region as a pivotal juncture where price reaction will likely shape the subsequent directional move. A breakdown from this area could intensify the selloff, whereas successful defense might trigger a rapid short-covering rally.
The subsequent major support zone extends from $66 to $70, consistent with observations from Crypto_Scient. Any upward movement toward $84–$89 may represent merely a retest of the violated structure rather than a genuine trend reversal.
Enterprise Adoption Accelerates
Despite the challenging price action, Solana’s network infrastructure continues attracting institutional integration. SoFi has deployed an enterprise-grade banking platform utilizing Solana’s blockchain technology, facilitating both fiat currency and stablecoin settlement operations. Tokenized real-world assets on the platform have crossed the $2 billion threshold, with Solana powering stablecoin transactions for prominent payment processing companies.
Analyst Crypto Patel emphasized that Solana has received commodity classification from regulators, positioning it within a separate regulatory framework. The asset currently trades approximately 77% beneath its historical peak valuation.
Chartist RoccobullboTTom observed that longer-term support continues developing within the $75–$85 corridor. A decisive recovery above $100 would transform the momentum landscape, establishing $120 and $125 as subsequent resistance objectives.
A significant $285 million security breach affecting Drift Protocol and impacting 20 separate protocols has contributed to elevated near-term risk perception surrounding the network.
Daily trading volumes currently surpass $1.68 billion, demonstrating sustained market engagement despite the downward price trajectory.