
 Stock: Rally Stalls at $2,400 Resistance — What’s Next?")
Key Takeaways
- Ethereum reached $2,417 before encountering strong selling pressure
- Critical resistance zone identified between $2,360 and $2,400; downside support located at $2,190–$2,295
- Large holders have distributed approximately 60K ETH after reaching their break-even prices
- Futures market open interest remains stagnant at 14.2 million ETH without fresh capital entering
- Spot Ethereum ETFs in the US recorded consecutive inflows over five sessions, totaling $67.8M on Wednesday alone
Ethereum’s recent advance stalled at $2,417 as profit-taking emerged, forcing the cryptocurrency back beneath the $2,350 threshold. This rejection occurred at a critical level that market observers have been monitoring closely.
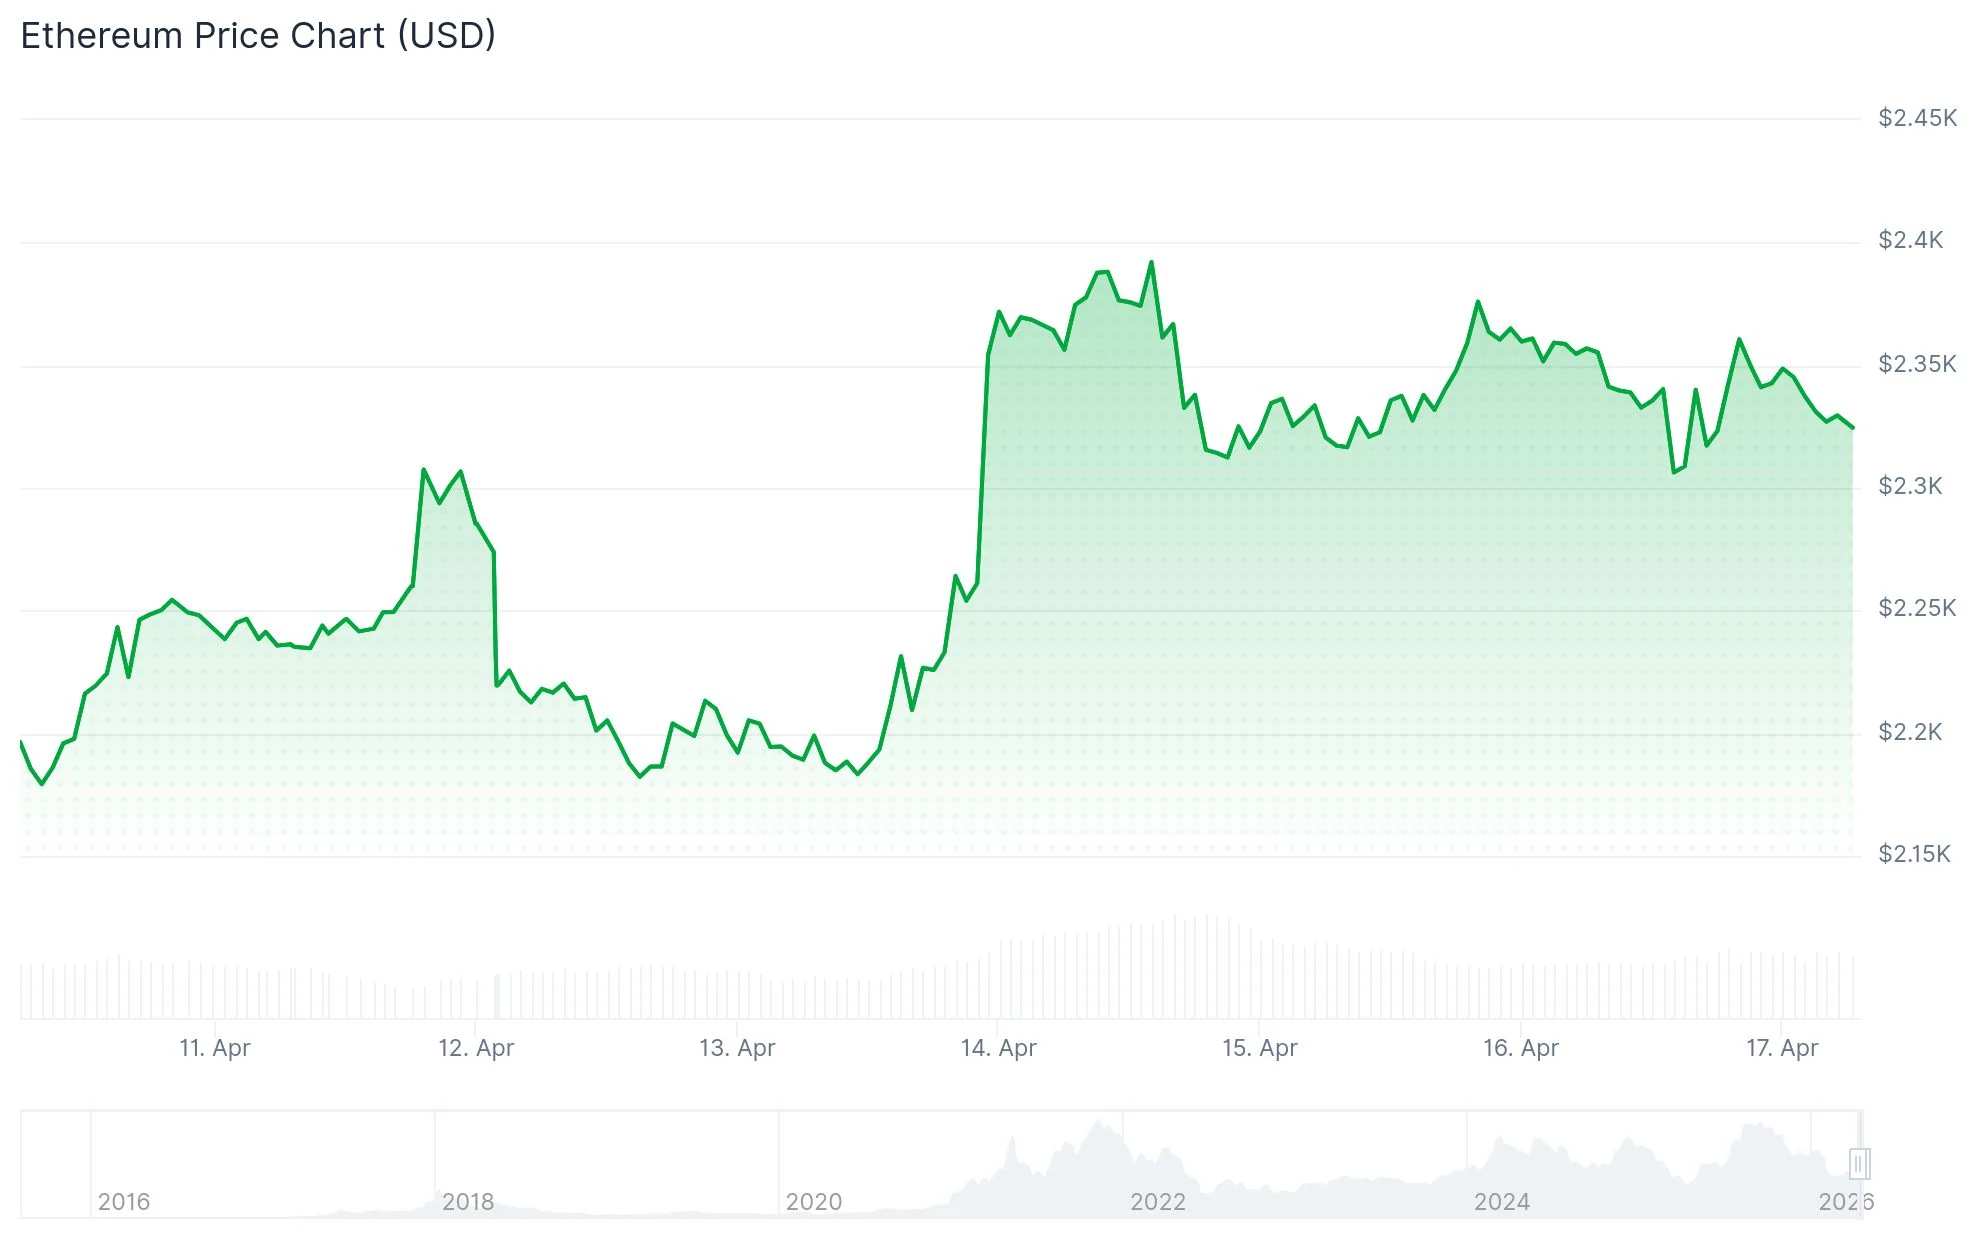
Current trading activity places ETH slightly above the $2,300 mark, maintaining position above its 100-hour Simple Moving Average. Resistance remains firm at $2,360, reinforced by a converging short-term trendline creating additional overhead pressure.
Multiple resistance barriers exist in the $2,360–$2,420 zone. Successfully breaching $2,420 would establish a pathway toward subsequent targets at $2,450, $2,500, and potentially $2,550. Should downward movement occur, initial support emerges at $2,295, with additional floors at $2,265 and $2,200.
Analyzing the daily timeframe reveals ETH maintaining ground above both the 20-day and 50-day Exponential Moving Averages, positioned at $2,214 and $2,190 respectively. The Relative Strength Index hovers near 61, indicating modest bullish momentum, though the Stochastic Oscillator reading near 84 suggests potentially overbought territory that may limit upside progress.

The 100-day EMA at $2,376 currently serves as nearby resistance, positioned just beneath the horizontal obstacle at $2,388. A decisive daily candle close surpassing this zone would bring $2,746 into focus, followed by the $3,411 target.
Large Holder Distribution Creates Headwinds
Blockchain analytics reveal that addresses controlling 10,000 to 100,000 ETH initiated selling operations once prices exceeded their average acquisition costs. These significant holders have released approximately 60,000 ETH into the market since Monday.

Additional cohorts managing between 100–1,000 and 1,000–10,000 ETH have collectively distributed around 350,000 ETH throughout the weekly period. Such distribution patterns typically indicate holders capitalizing on opportunities to exit positions near their cost basis.
Open interest in ETH futures contracts has plateaued around 14.2 million ETH following the earlier weekly price surge. The seven-day rolling average of the Taker Buy-Sell Ratio has begun declining, signaling diminishing buyer enthusiasm within derivatives markets.
Liquidation data over the previous 24-hour period shows $111.6 million in forced position closures. Long contracts accounted for $70.8 million of these liquidations.
Institutional Demand Provides Modest Cushion
United States-based spot Ethereum exchange-traded funds registered positive net flows across five consecutive trading sessions. Wednesday’s session alone attracted $67.8 million in fresh capital, based on SoSoValue tracking. While this reflects renewed institutional appetite, market analysts characterize the inflow velocity as moderate.
The 4-hour technical chart illustrates ETH’s rejection from the $2,360 resistance boundary and subsequent retreat toward the $2,190 support foundation. Sustained defense of this lower level could facilitate another challenge of the $2,400 region.
Ethereum presently trades at $2,350, preserving its position above near-term moving averages, with the $2,360 threshold representing the immediate hurdle requiring clearance.