
 Stock Plunges Below $2,000 Amid Prolonged Institutional Retreat")
Key Takeaways
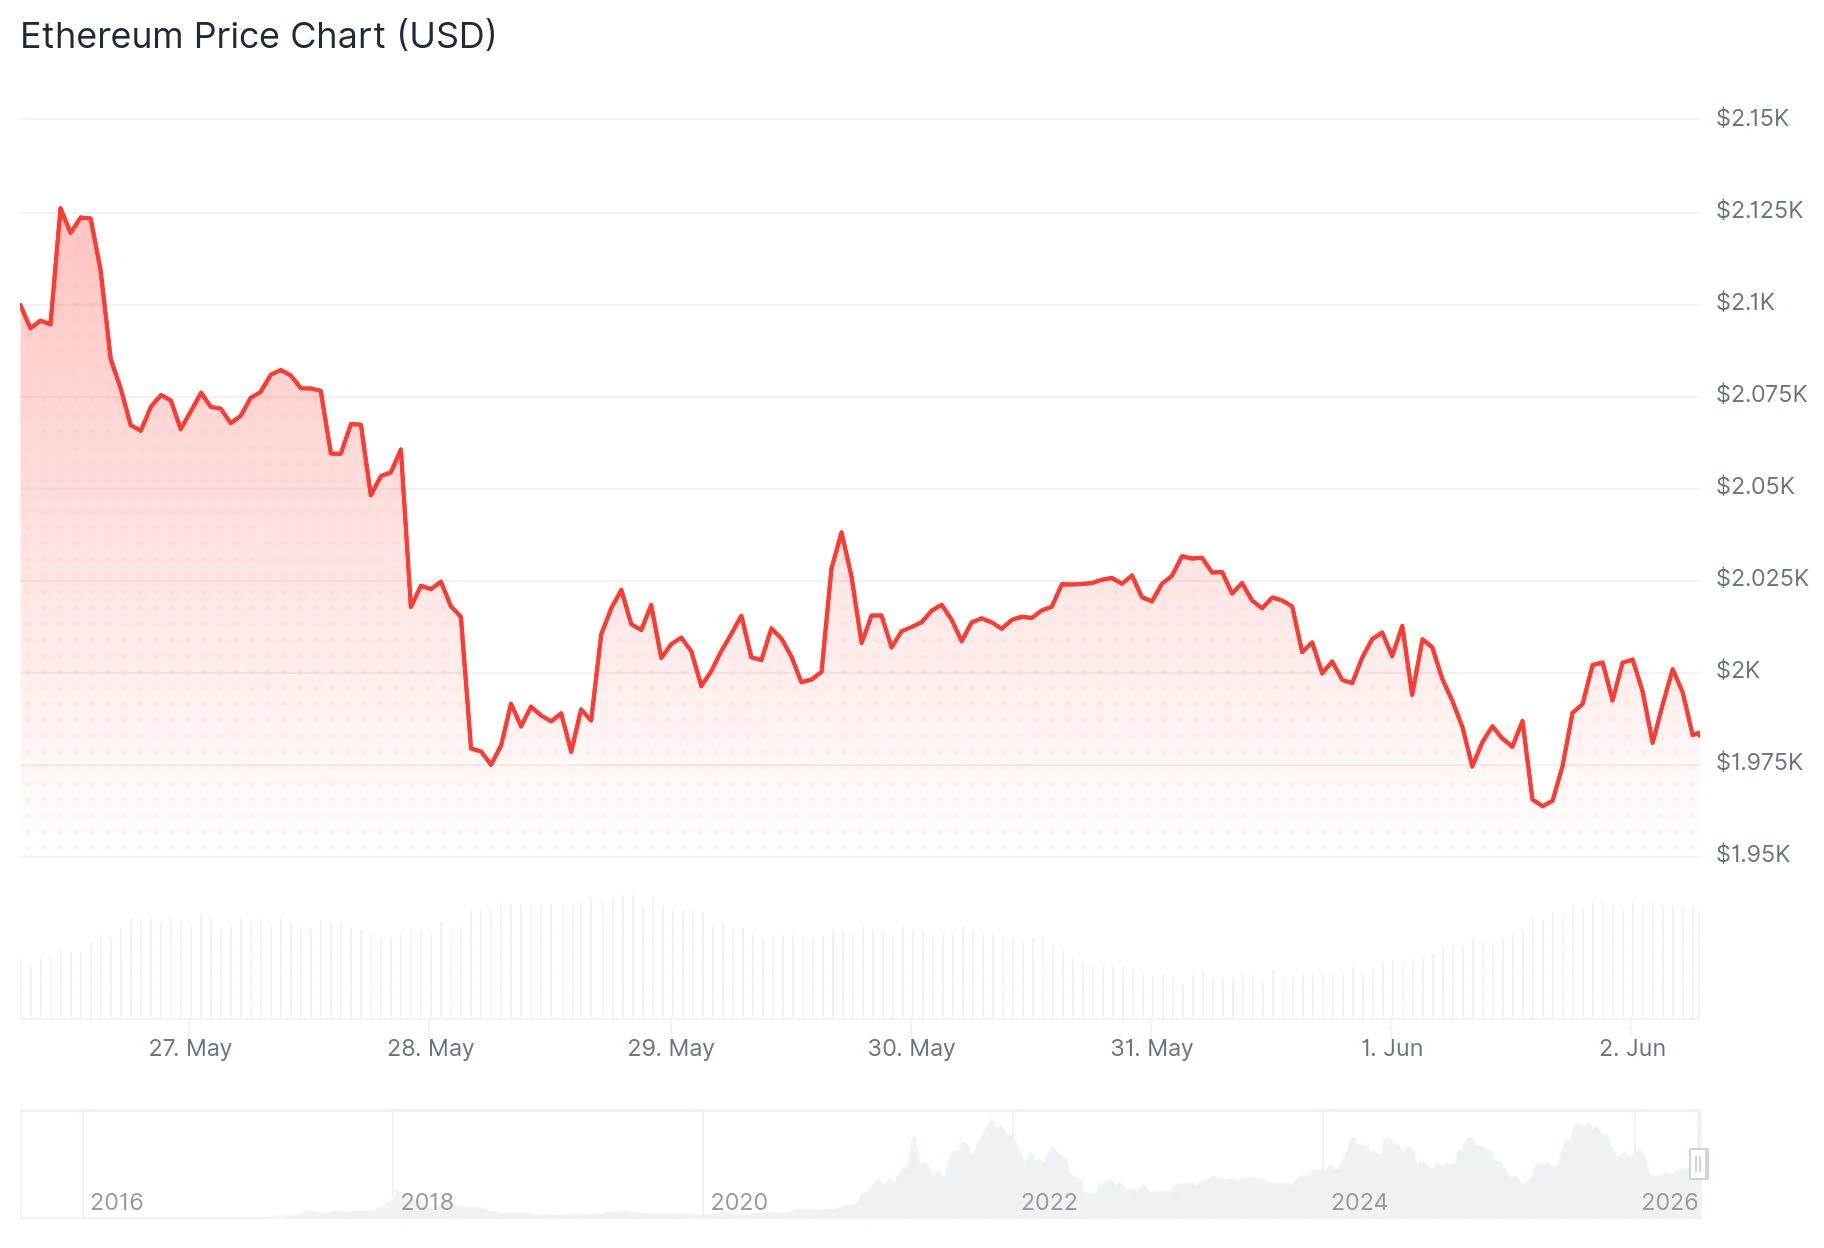
- Ethereum plunged beneath $2,000, reaching an intraday bottom of $1,955
- BitMine acquired just 26,497 ETH in the past week — marking one of its smallest weekly purchases since implementing its ETH treasury approach
- BitMine’s Ethereum position currently shows unrealized losses near $9 billion
- Spot Ethereum ETFs in the United States posted their third consecutive week of negative flows
- Critical support zone lies at $1,909; falling below this threshold could trigger a move toward $1,741
Ethereum has slipped beneath the psychologically important $2,000 mark following renewed bearish momentum that drove prices to an intraday low of $1,955. The second-largest cryptocurrency continues to face headwinds as sellers maintain dominance across various time horizons.
BitMine Immersion Technologies (BMNR) added 26,497 ETH to its reserves during the previous week, pushing total holdings to 5.41 million ETH with a current valuation near $10.72 billion. This acquisition represents one of the company’s smallest weekly additions since adopting its Ethereum-focused treasury model in early 2025.
According to BitMine Chairman Thomas Lee, the reduced acquisition tempo stems from the company running ahead of its target timeline to secure 5% of Ethereum’s total circulating supply. Lee further noted that prevailing ETH valuations fail to properly reflect the network’s strengthening fundamental metrics.
Nevertheless, CryptoQuant data reveals BitMine’s entire ETH position currently sits approximately $9 billion below its average acquisition cost.

Crypto analyst Rekt Capital highlighted on X that Ethereum has now registered a second monthly close beneath its long-term ascending trendline within a five-month span. He cautioned that bounces from this technical level are showing diminished strength, emphasizing ETH must either defend its 2026 lows or successfully reclaim the trendline to prevent additional downside.
Persistent Institutional Withdrawals Weigh on Sentiment
U.S.-listed spot Ethereum ETFs have registered negative net flows for three straight weeks, according to SoSoValue tracking data. This extended withdrawal pattern reflects ongoing hesitation among institutional market participants.
Strategy, which holds the distinction of operating the largest cryptocurrency treasury by asset value, revealed it liquidated 32 BTC during the prior week for approximately $2.5 million to cover preferred share dividend obligations. This transaction contributes to the wider narrative of digital asset treasury entities confronting market headwinds.
Ethereum experienced $106.3 million in forced liquidations throughout the past 24-hour period. Long position liquidations comprised $90.3 million of this figure, based on Coinglass tracking systems.
Critical Technical Levels in Focus
On the daily timeframe, Ethereum is positioned beneath its 20-, 50-, and 100-day exponential moving averages located at $2,098, $2,172, and $2,269 respectively. This configuration of all three major moving averages residing above spot price traditionally indicates bearish market structure.
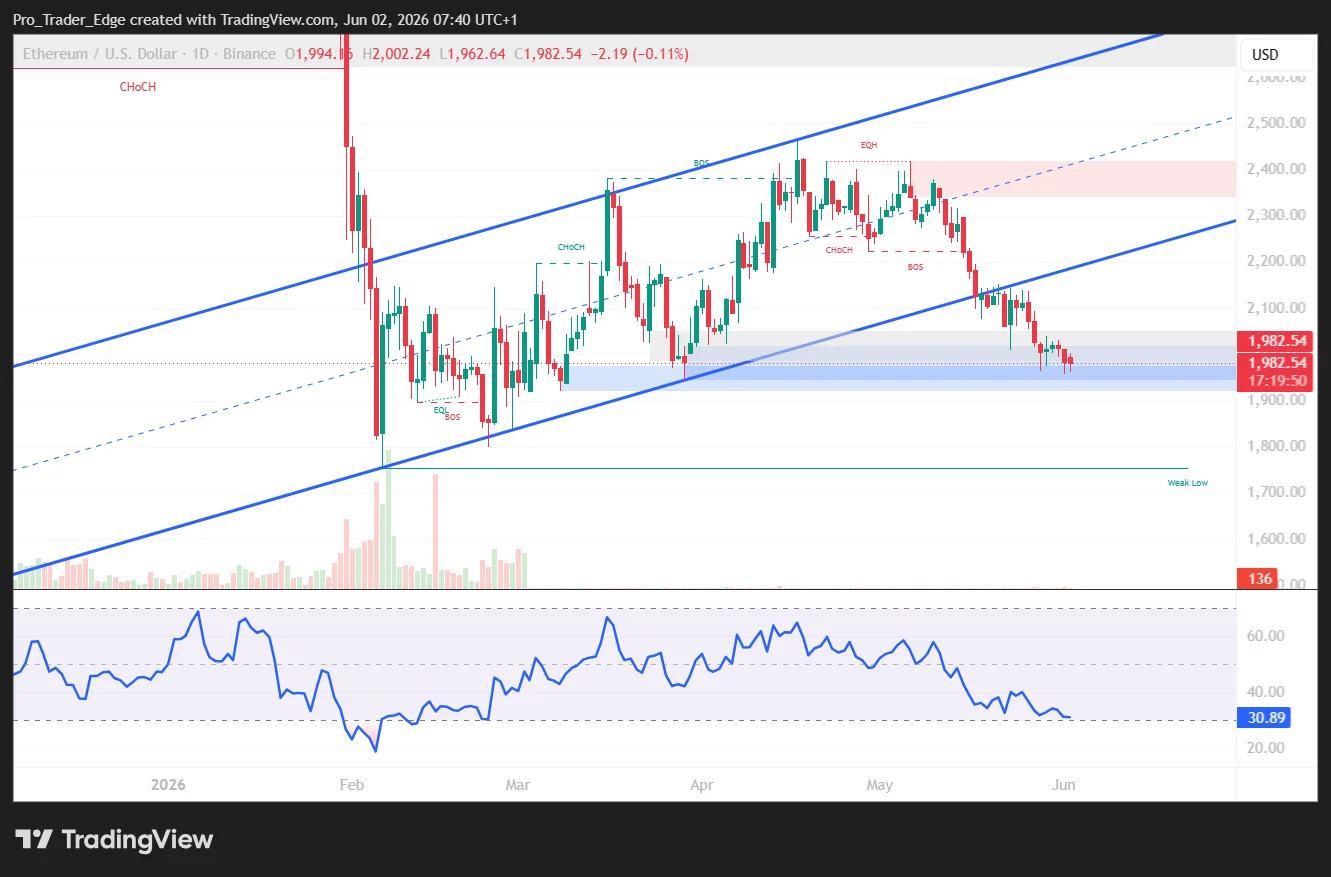
The 14-period Relative Strength Index currently registers near the 30 threshold while the Stochastic Oscillator remains entrenched in oversold conditions. Although these readings confirm intense selling activity, they alone do not guarantee an imminent price reversal.
Looking toward resistance, overhead barriers are positioned at $2,000, $2,020, $2,050, and $2,080. A successful breakout above $2,050 would potentially unlock pathways toward $2,120 or even $2,150.
Regarding downside protection, initial support materializes at $1,955, trailed by $1,920 and the pivotal $1,909 zone. A decisive breach beneath $1,909 would bring $1,741 into immediate view, with progressively deeper levels at $1,524 and $1,404 if bearish pressure intensifies.
ETH was most recently changing hands around $1,980, positioned below the 100-period Simple Moving Average on hourly charts, with a descending trendline resistance pattern emerging near $2,010 on shorter timeframes.