
 Stock: Multiple Analysts Converge on Bearish $1,800 Target Amid Mounting Pressure")
Key Takeaways
- Ethereum is currently hovering just above the $2,000 mark, having retreated from recent peaks with sellers maintaining dominance.
- Multiple technical analysts identify failed resistance levels and project potential declines toward $1,900 or deeper.
- One 4-hour analysis indicates a possible drop to $1,387 should ETH fall beneath the $1,755 threshold.
- Daily trading activity surged 150% to approach $19 billion as market participants defend the psychological $2,000 level.
- Blockchain metrics point to a potential cycle low forming near the $1,800 zone based on historical MVRV patterns.
Ethereum currently confronts headwinds from several converging forces. Technical charts, blockchain analytics, and broader economic factors are aligning to suggest continued downward momentum.
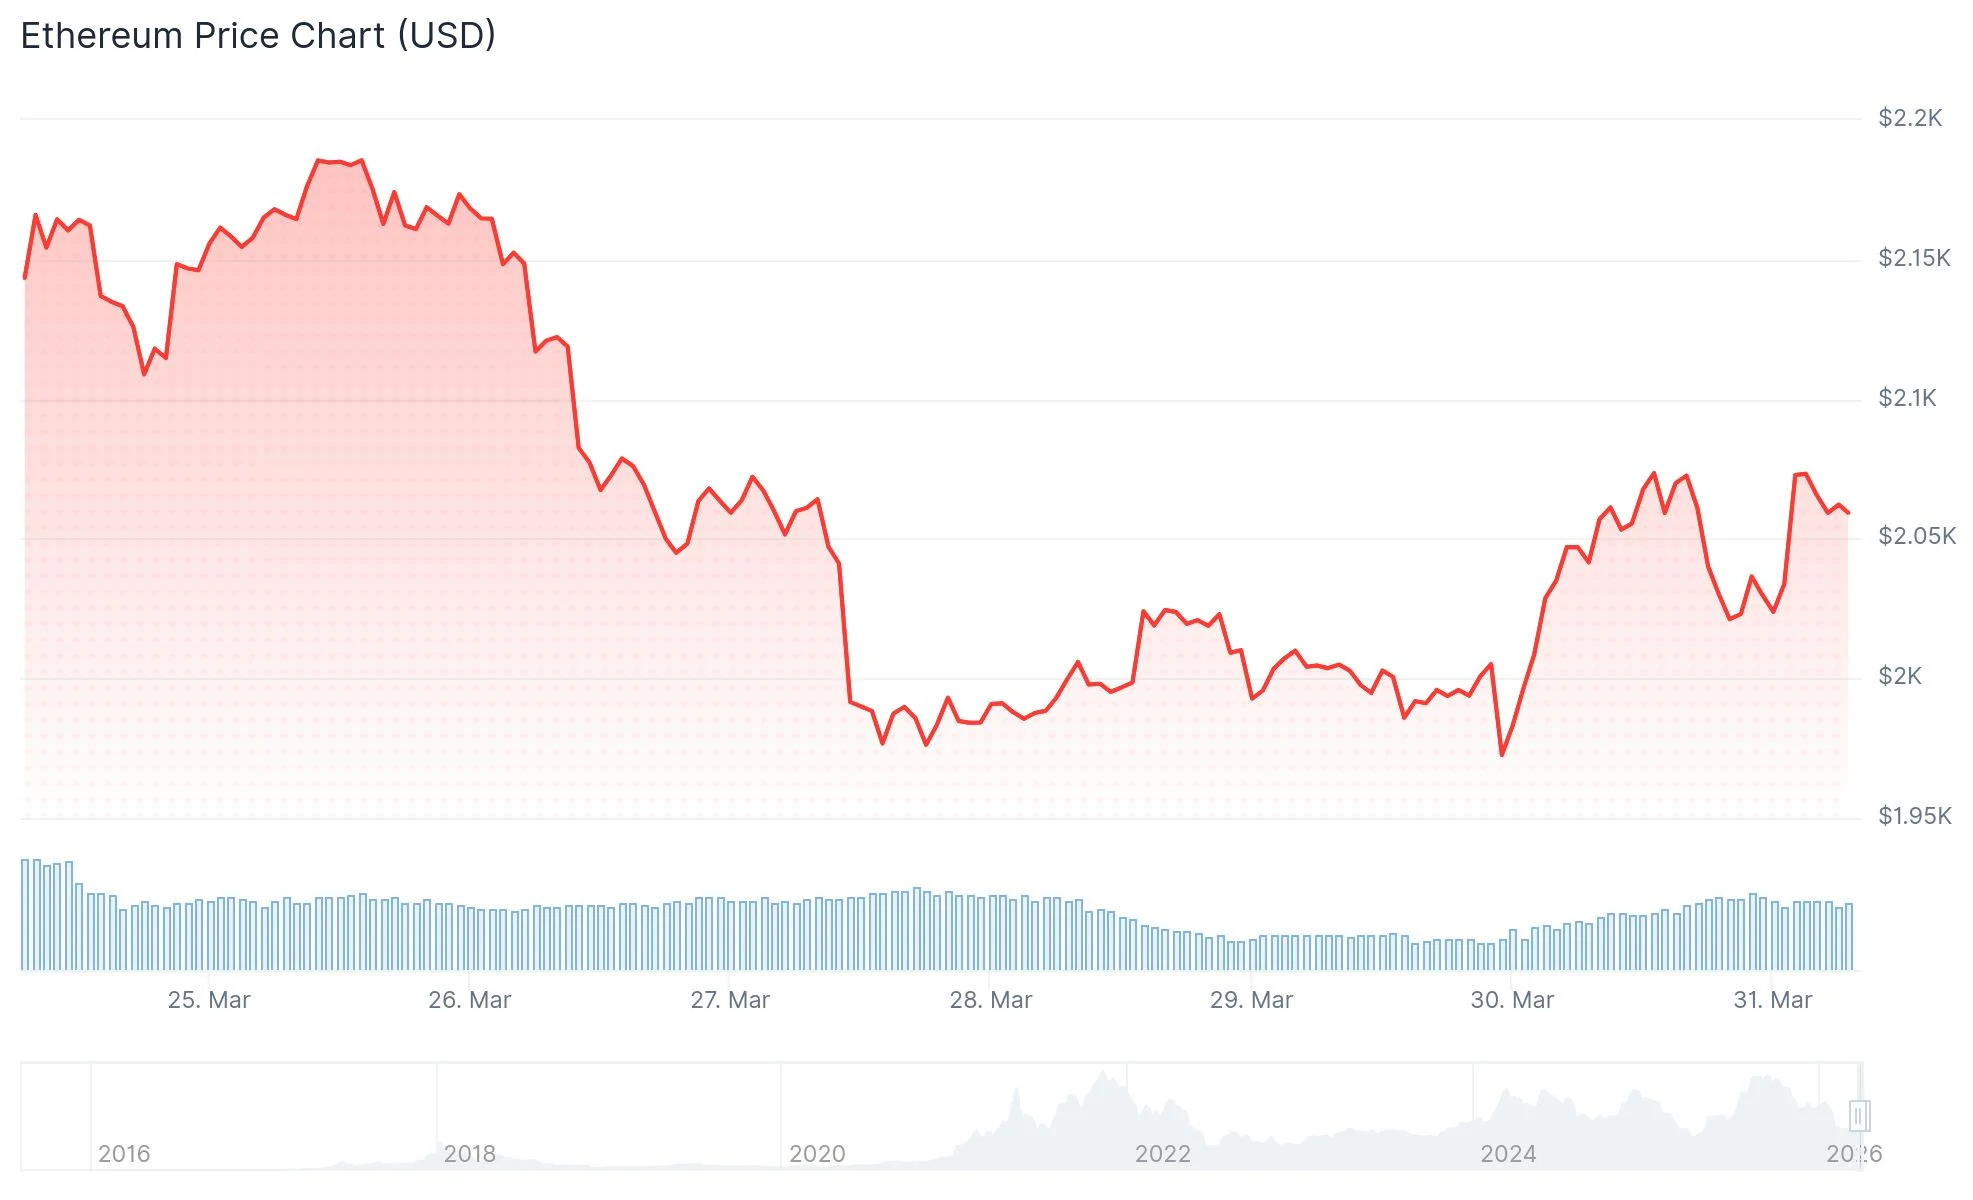
The second-largest cryptocurrency by market capitalization is clinging to support just north of $2,000. Earlier this weekend, ETH briefly slipped beneath this psychological threshold before buyers mounted a defense. However, the subsequent rebound has lacked conviction. After touching an intraday peak of $2,085, the asset retreated to approximately $2,036, with market observers noting that sellers continue to dictate price movement.
Daily exchange activity jumped 150% over the past 24 hours, climbing to nearly $19 billion in notional value. This represents approximately 9% of Ethereum’s entire circulating supply valuation. While elevated volume during relief rallies can signal authentic accumulation, the current uptick hasn’t yet translated into a meaningful trend reversal.
Broader economic conditions are compounding the challenge. Crude oil prices have climbed back above the $100 per barrel threshold amid escalating tensions involving Iran. This development pressures risk-sensitive assets across the board, with digital currencies particularly vulnerable. The situation also increases the likelihood that the U.S. Federal Reserve will postpone anticipated interest rate reductions, creating additional headwinds for speculative asset classes.

Technical Analysis Reveals Converging Bearish Signals
Market analyst Elja presented a 12-hour timeframe chart highlighting a recurring formation. Ethereum has staged multiple recovery attempts, yet each upward move has failed to breach the overarching downtrend line. His trajectory model suggests ETH could climb toward the $2,200–$2,300 range before encountering resistance, then reversing course back below $2,000 with targets near $1,900.
Separately, technical analyst Man of Bitcoin shared a 4-hour chart displaying a more pessimistic scenario. His framework identifies a prominent descending trendline functioning as overhead resistance. Should Ethereum breach the $1,755 support zone, his analysis projects a potential decline toward $1,387. Elliott Wave annotations on the chart indicate the market remains within a corrective downward sequence rather than completing a bottoming formation.
On social platform X, analyst Ted Pillows highlighted that Ethereum has surrendered its RSI uptrend, warning: “Price will be next.” The Relative Strength Index has already fallen below its 14-period moving average. The indicator momentarily dropped beneath the 40 threshold, a level technical traders monitor as evidence that selling pressure has taken firm control.
Blockchain Metrics Highlight the $1,800 Support Zone
One particular on-chain indicator has captured market attention: the 365-day Market Value to Realized Value (MVRV) Ratio. When this metric falls into negative territory, it signals that a majority of token holders are currently underwater on their positions. A comparable pattern emerged in April 2025, immediately preceding a substantial ETH rally.
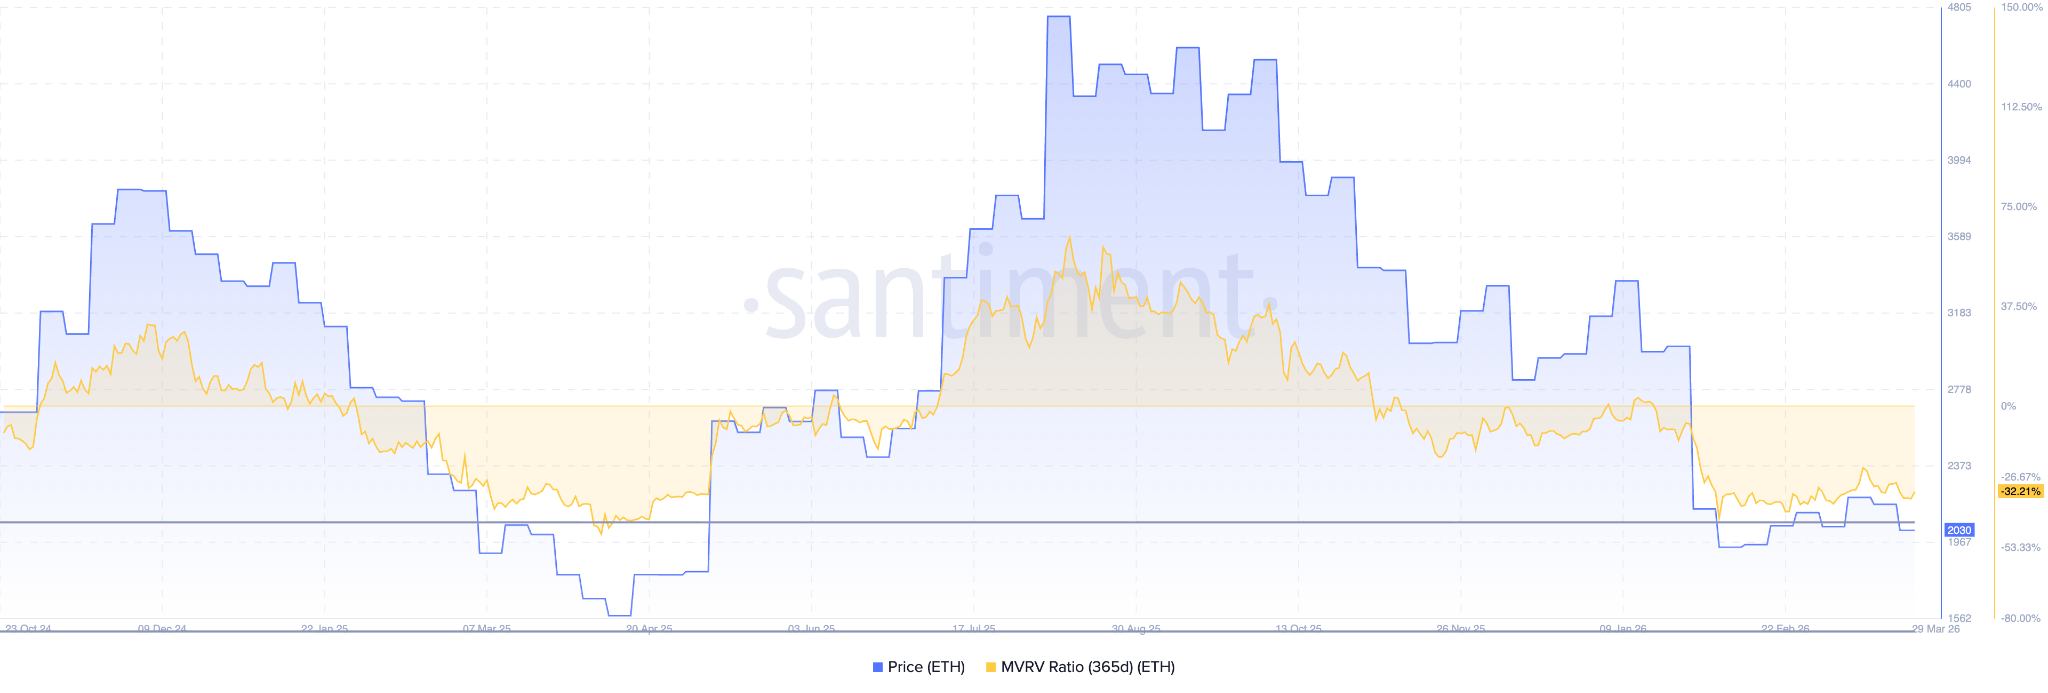
Given current metric readings, several blockchain analysts identify $1,800 as the probable support floor for the present market cycle. While a brief recovery toward $2,150 remains within the realm of possibility, the predominant technical structure continues to favor additional downside. The only development that would invalidate the bearish thesis is a decisive breakout above $2,150, which could potentially catalyze a short-covering cascade.
As of this writing, Ethereum trades marginally above the $2,000 level with sellers maintaining control and the next critical support zone established at $1,800.