
 Stock: Geopolitical Tensions Drive 8% Decline as Key Support Levels Come Into Focus")
Key Takeaways
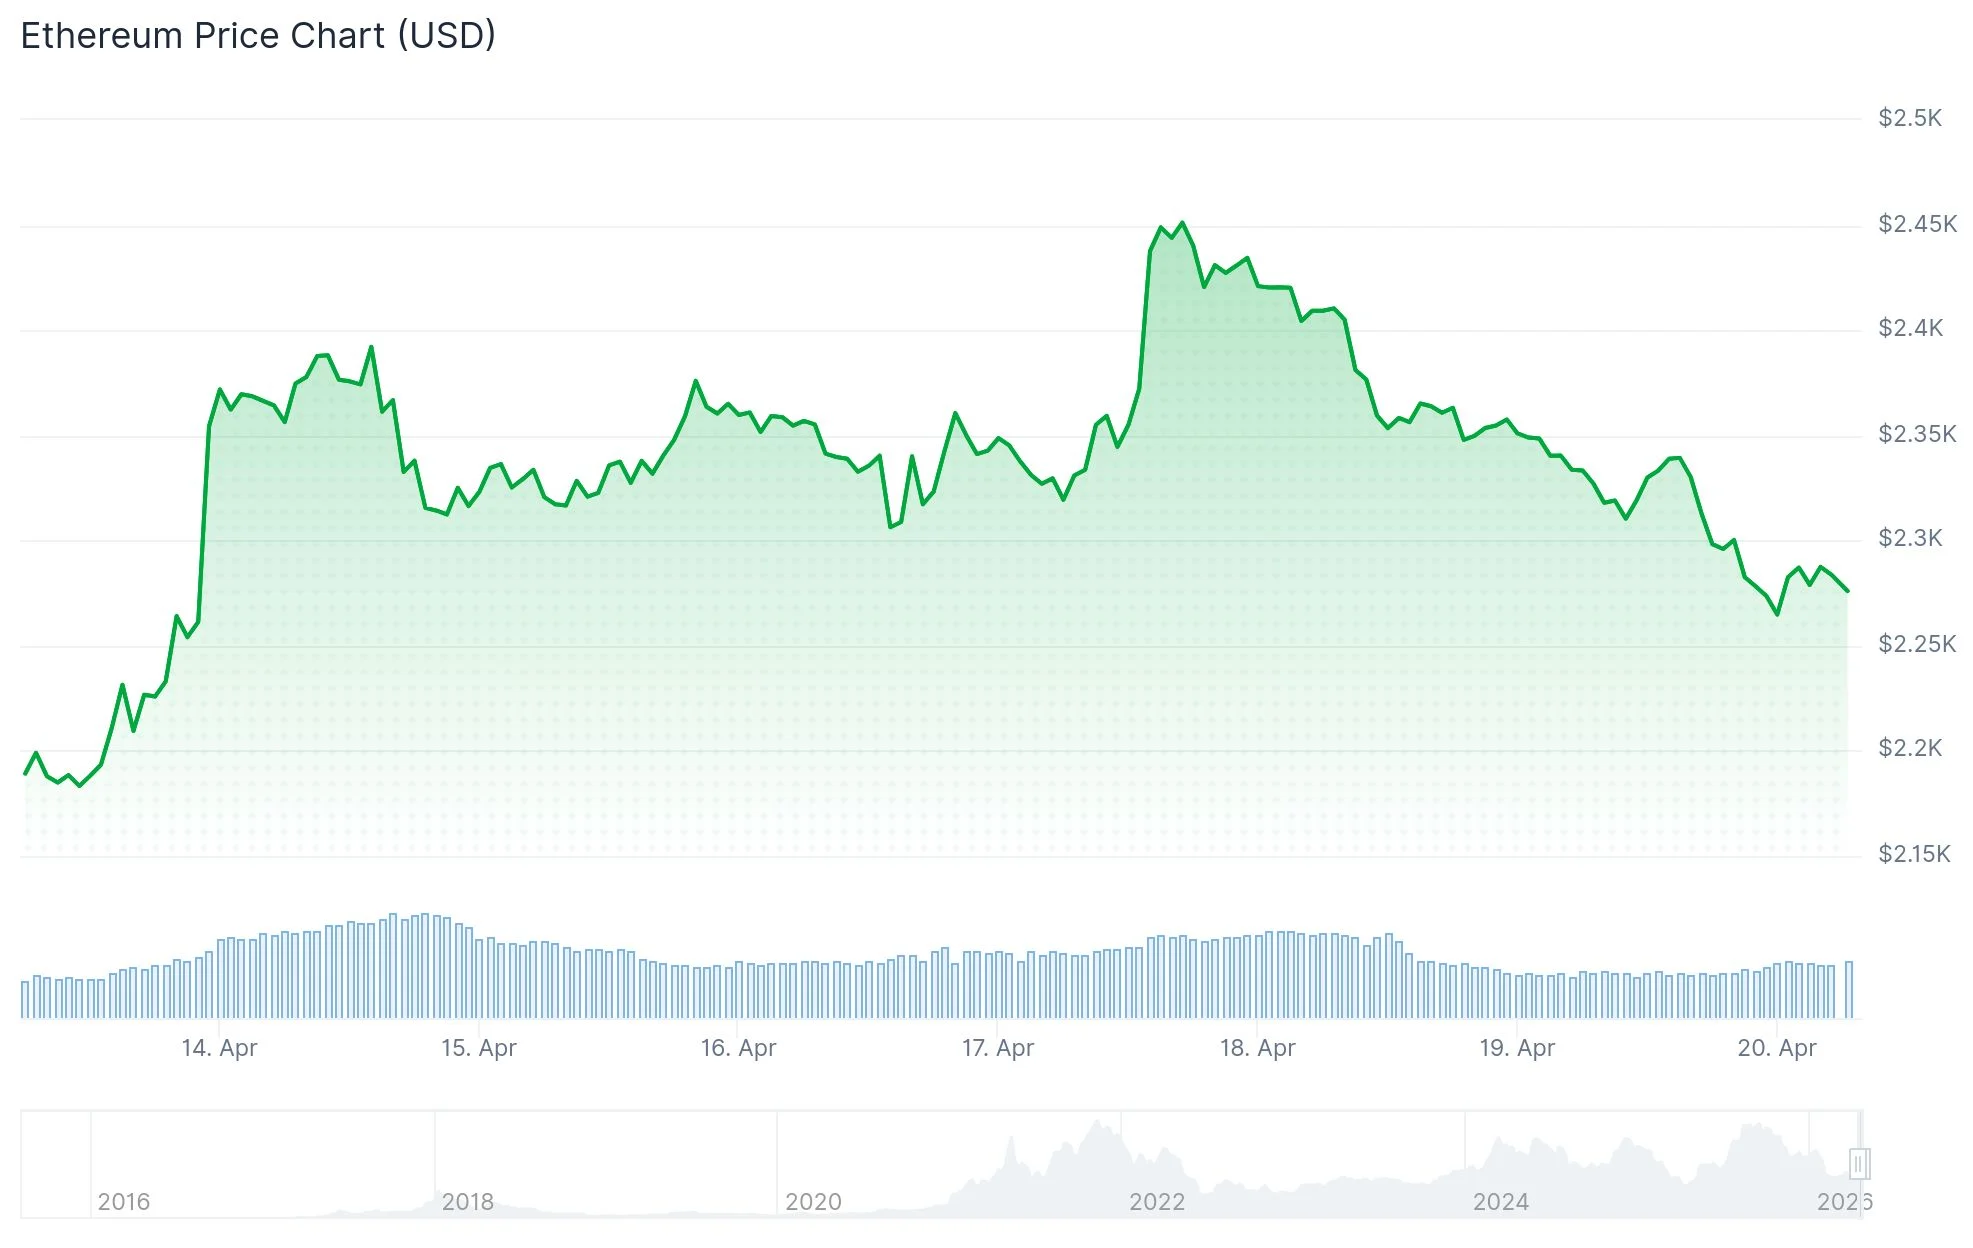
- Ethereum has fallen beneath $2,350, currently hovering around $2,253 following rejection at the $2,420 resistance zone
- Technical analysis reveals a bearish pattern emerging on the hourly timeframe with critical resistance positioned at $2,300
- Institutional interest remains robust as Ethereum spot ETFs attracted $276 million in net capital during the previous week, with Fidelity’s FETH dominating at $126 million
- Staking participation has surpassed 32% of total supply, creating supply constraints across trading platforms
- Market sentiment shows improvement as Net Taker Volume has shifted to positive territory at approximately +$102 million since March, indicating renewed buying interest
Ethereum experienced a significant pullback from $2,465, plummeting to an intraday low of $2,253 in a swift downward movement. The digital asset is currently trading beneath both the 100-hour Simple Moving Average and the 23.6% Fibonacci retracement level calculated from the recent price swing.
Technical indicators show a descending trendline developing on the hourly ETH/USD chart, with meaningful resistance established at the $2,300 mark. The cryptocurrency is presently stabilizing just above the $2,250 threshold, a level market observers identify as crucial near-term support.
Should Ethereum maintain its position above $2,250, there’s potential for renewed upward momentum. Initial resistance barriers are located at $2,300, followed by $2,335. A decisive breakout above $2,360—corresponding to the 50% Fibonacci retracement from the latest downturn—might pave the way toward $2,415 and ultimately $2,465.
Conversely, a breakdown below $2,220 would likely accelerate selling pressure toward $2,200, with subsequent targets at $2,150 and potentially $2,120.

Institutional Capital Continues Flowing In
Despite bearish price momentum, Ethereum spot exchange-traded funds demonstrated remarkable strength by accumulating $276 million in net inflows during the April 13-17 trading week. Fidelity’s FETH dominated institutional flows, capturing $126 million in weekly investments and elevating its cumulative historical inflows to $2.36 billion.
BlackRock’s ETHA secured second position with $99.2 million in weekly contributions. ETHA has now amassed $11.83 billion in total net inflows since inception. Grayscale’s ETHE represented the sole outflow among major products, recording $16.7 million in weekly redemptions. The aggregate net assets across all Ethereum spot ETFs currently total $14.26 billion.
Supply Dynamics and Market Structure
Over 32% of the entire Ethereum supply is now locked in staking contracts, effectively withdrawing substantial volume from active trading circulation. This development constrains available inventory on centralized exchanges and progressively reduces order book depth.
CryptoQuant analytics reveal perpetual futures trading volume hit $34.74 billion against spot market volume of just $14.29 billion, demonstrating that market participants favor derivative instruments over direct purchases. Open interest contracted by 5.75% to $31.18 billion, while funding rates have dipped into negative territory, suggesting mounting short-side pressure.
Nevertheless, encouraging signals suggest accumulation may be underway. Net Taker Volume has rotated into positive territory at roughly +$102 million since March, reversing the aggressive selling behavior observed during earlier rallies, which registered -$568 million near the $5,000 price peak.
Based on current market data, ETH continues trading below $2,350, with immediate price trajectory dependent upon bulls successfully defending the $2,250 support zone.