
 Stock Faces Critical Support Test: $2,000 or $2,400 Next?")
Quick Overview
- Ethereum currently trades near $2,181, facing a crucial test at the $2,150–$2,200 support range.
- Breaking beneath $2,150 could trigger a move toward the psychologically significant $2,000 mark.
- Current RSI reading stands at 53.53, with ETH positioned above shorter-term moving averages but trailing longer-term indicators.
- Ali Charts’ weekly analysis identifies deeper safety nets at $1,550 and $1,070 should present support crumble.
- Maintaining above existing support levels could fuel a climb toward $2,400, with extended upside targeting $2,624.
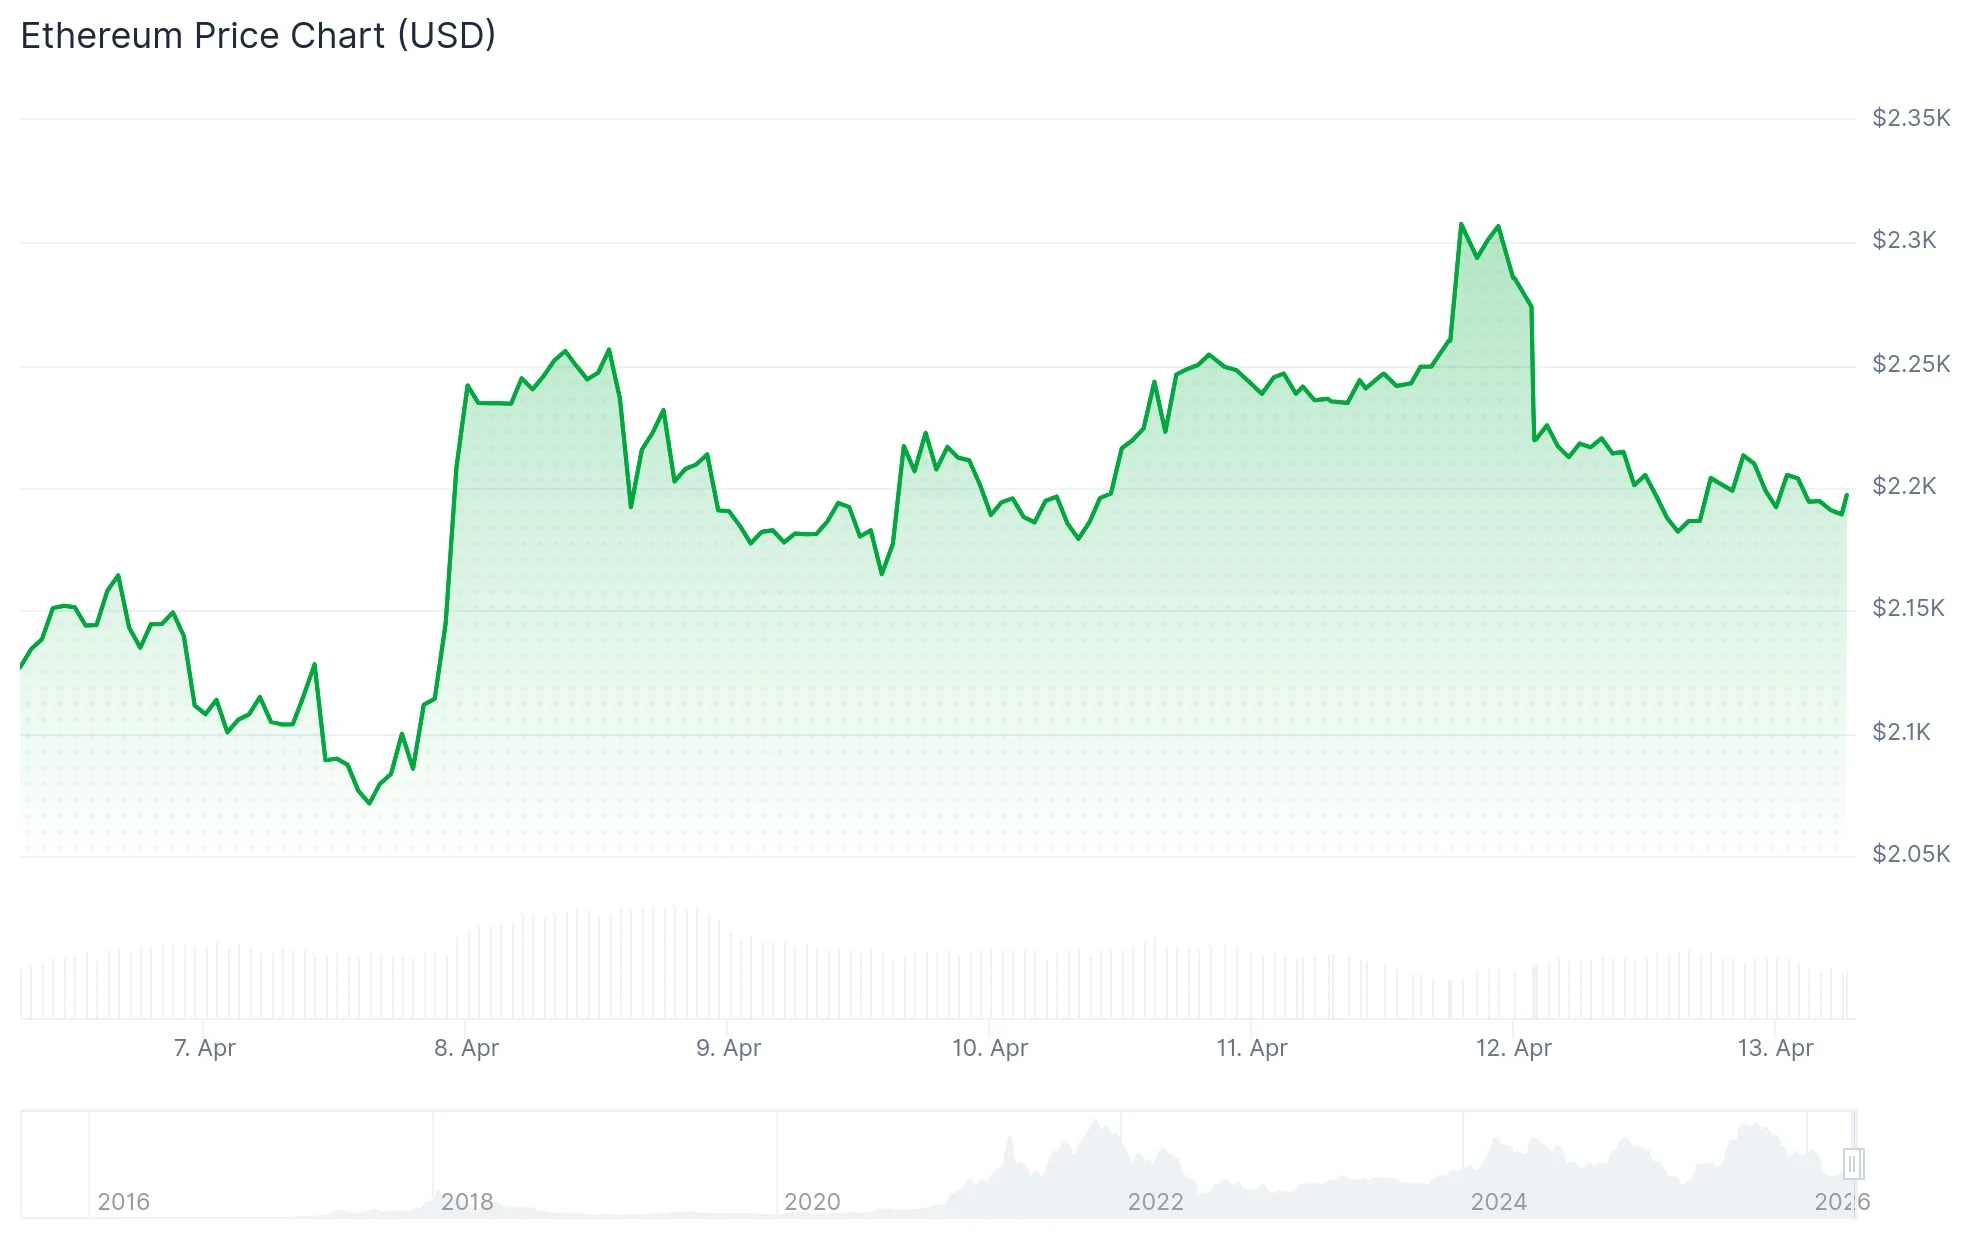
Ethereum has reached a critical juncture that market participants are monitoring with heightened attention. Currently, ETH changes hands at $2,181.19, reflecting a 2.89% decline within the last 24-hour period. The asset registers $28.19 billion in trading volume alongside a market capitalization of $263.38 billion.
Market observers are concentrating heavily on the $2,150–$2,200 range. Technical analyst Ted highlighted via X that Ethereum momentarily approached a breakdown below $2,200, influenced by widespread risk-aversion across international financial markets. According to his assessment, this particular zone represents where purchasing interest is expected to emerge.
Maintaining support above $2,150 would suggest near-term sideways movement with potential advancement toward $2,400. This price point represents the initial significant barrier. Beyond this threshold, charting analysis identifies approximately $2,624 as the subsequent objective.
Should the $2,150 threshold fail to hold, bearish pressure would likely direct ETH toward $2,000 — a rounded figure that has historically provided psychological support.

Indicators Present a Divided Technical Landscape
From an analytical standpoint, the Relative Strength Index registers 53.53, marginally exceeding the mean of 53.40. This measurement suggests mild bullish characteristics without demonstrating forceful directional momentum.
ETH maintains positioning above both its 20-day Simple Moving Average ($2,117.30) and 50-day SMA ($2,080.00), indicating that immediate support structures remain intact. Conversely, current pricing sits beneath the 100-day SMA at $2,360.14 and the 200-day SMA at $2,918.05. This configuration places the extended trend in a vulnerable state.
The MACD indicator hovers marginally above its signal line, potentially suggesting preliminary stabilization. Nevertheless, market watchers emphasize that stronger accumulation is required before confirming a definitive reversal.
Extended Timeframe Analysis Identifies $1,550 and $1,070 Targets
Market analyst Ali Charts shared a weekly Ethereum evaluation on X demonstrating that Ethereum might continue trading within a parallel formation. Based on this examination, the two primary downside objectives are positioned at $1,550 and $1,070.
These figures aren’t arbitrary — both correspond with historical response zones on the weekly timeframe. The $1,550 marker would serve as the initial substantial foundation should current support deteriorate. Beneath that threshold, $1,070 represents the more substantial safety level.
Daily charting also reveals that losing the $2,155 region would direct ETH toward approximately $2,015. Further deterioration would identify $1,775 as an additional support area.
As of April 13, 2026, Ethereum trades at $2,181.19 with the $2,150 level serving as the decisive demarcation for immediate price movement.