
 Stock: Daily SuperTrend Flips Bullish for First Time in Nearly a Year")
Key Takeaways
- Ethereum surged 9% Monday but encountered strong resistance at the $2,200 threshold
- The 50-day EMA positioned at $2,200 serves as resistance; the 50-day SMA at $2,000 provides support
- Spot Ethereum ETF flows reversed to negative, recording over $27.5 million in net outflows for the week through March 20
- Successfully breaking $2,200 could activate a measured projection to $3,080 derived from a symmetrical triangle formation
- For the first time since May of last year, the SuperTrend indicator on the daily timeframe has shifted to bullish (green)
Ethereum’s latest upward momentum encountered significant resistance at the $2,200 mark on Monday, despite a prominent technical indicator displaying its first positive signal in approximately ten months.
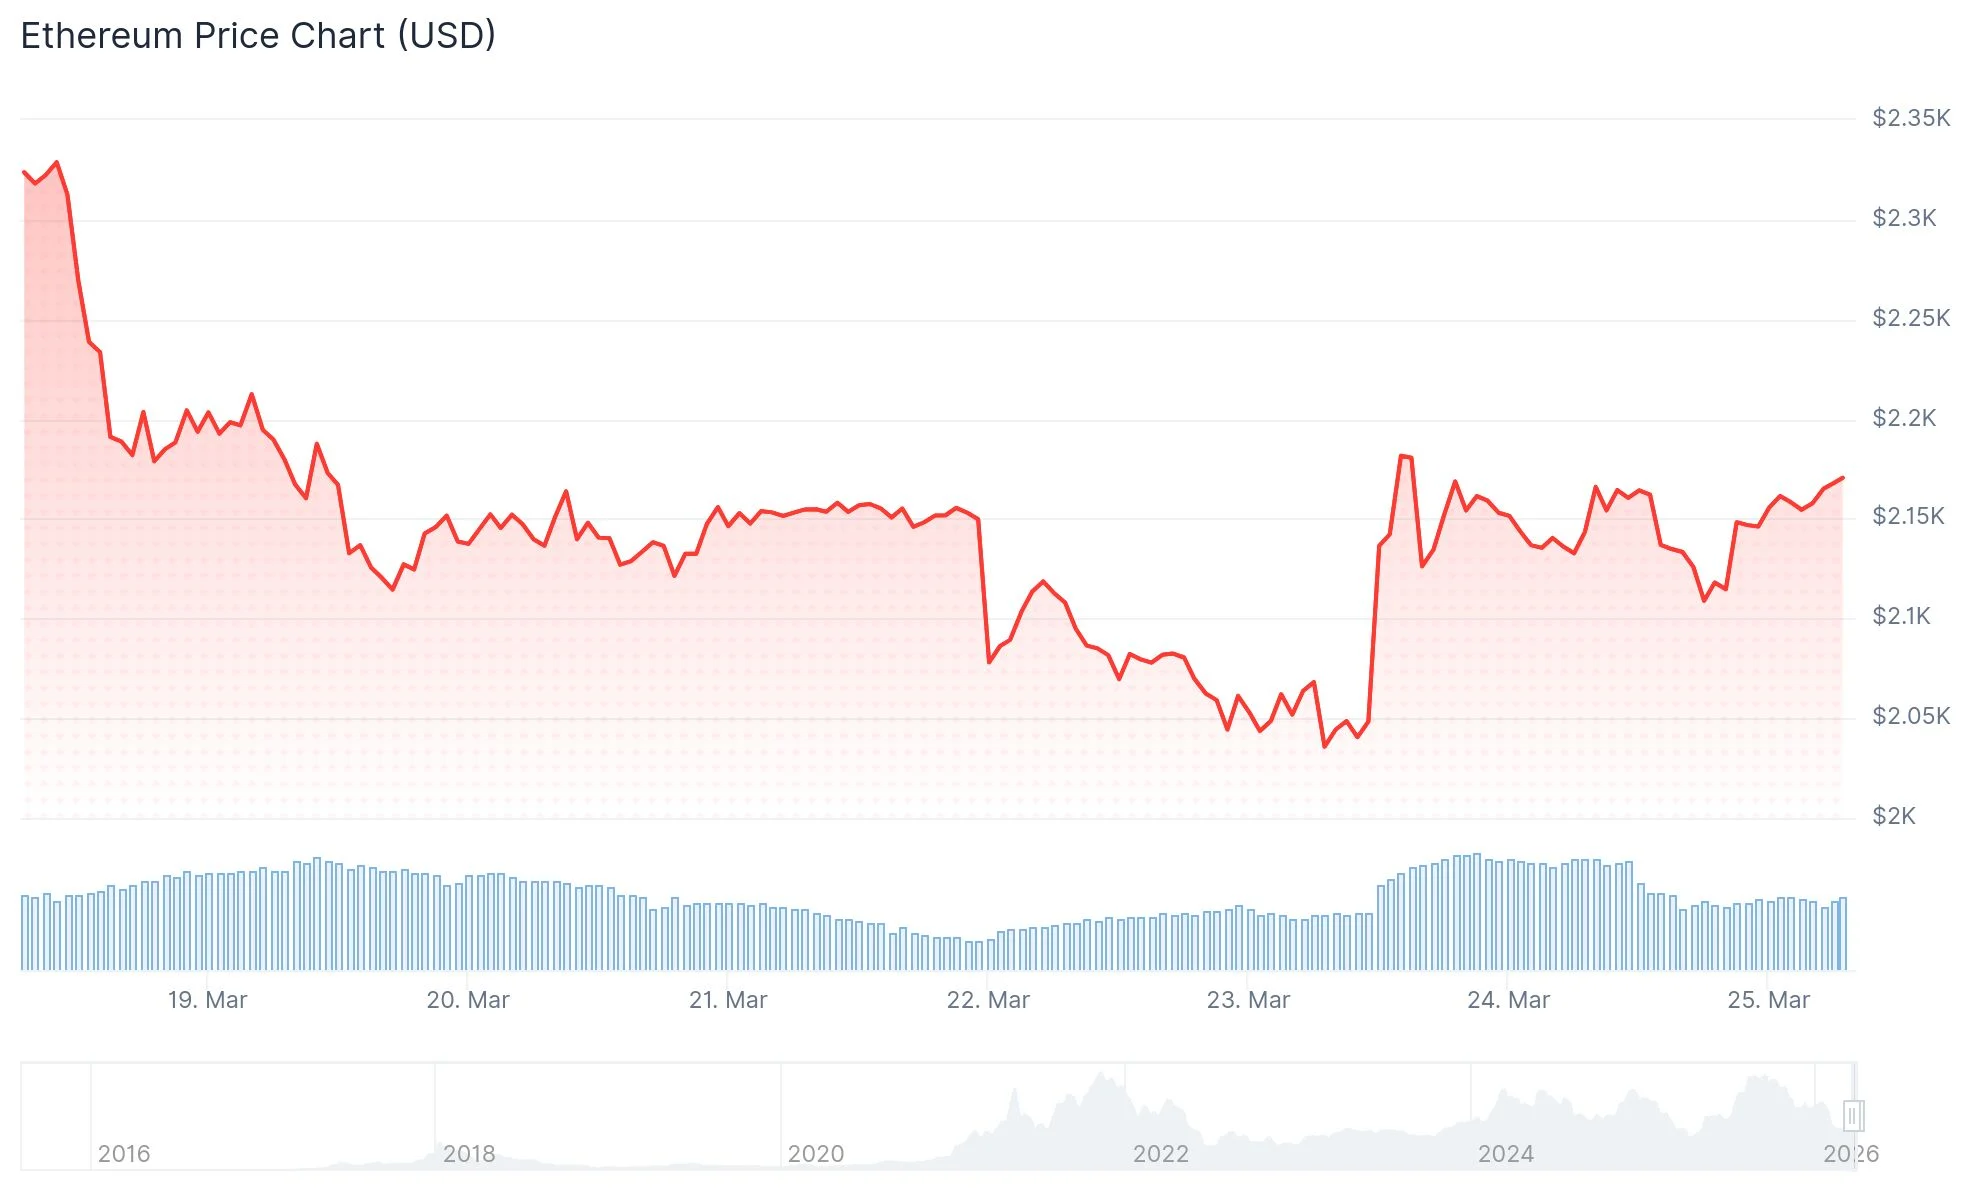
ETH advanced approximately 9% during Monday’s session but failed to penetrate the $2,200 price zone. This threshold aligns precisely with the 50-day exponential moving average (EMA), which is currently functioning as a significant overhead barrier.
The cryptocurrency is presently trading above $2,120 and maintaining position above the 100-hour simple moving average. Additionally, it has successfully breached a short-term descending trend line that had capped price action at $2,145 on the hourly timeframe.
Critical Price Zones Under Observation
The nearest resistance barriers stand at $2,180, followed by $2,200. Beyond these levels, subsequent upside targets include $2,250, $2,300, and $2,345.

Should ETH establish a decisive close above $2,200, the symmetrical triangle formation visible on the daily chart suggests a measured objective of $3,080, representing approximately a 42% advance from present price levels.
Nevertheless, before achieving that target, buyers would encounter substantial resistance between $2,780 and $2,880. This zone represents a convergence point where the 200-day EMA, 50-week EMA, and 100-week EMA intersect. According to Glassnode analytics, investors accumulated over 7.5 million ETH within the $2,750–$2,850 price range.
Regarding downside risk, should $2,000 fail to maintain support, analyst Ted Pillows highlighted in an X platform post: “Now, the only crucial support level for Ethereum is $2,000 and if ETH loses it, the dump will accelerate to new lows.” The bearish triangle projection indicates a potential decline to $1,400.
ETF Activity Remains Challenging
A primary obstacle for ETH currently stems from institutional participation. Spot Ethereum ETF flows have reverted to negative territory following a short-lived period of positive inflows. The 30-day moving average of US spot ETH ETF flows has slipped back below zero.
Worldwide Ethereum investment vehicles recorded more than $27.5 million in net withdrawals during the week concluded March 20.
The count of corporations purchasing ETH as a treasury reserve has declined dramatically since August 2025. The notable outlier is Bitmine Immersion Technologies, under the leadership of Tom Lee, which acquired $139 million worth of ETH in the previous week. Bitmine’s current holdings stand at 4.66 million ETH, progressing toward its declared objective of securing 5% of the circulating supply.
On a constructive note, cryptocurrency analyst Ali Charts shared on X: “Momentum is finally shifting back to the Ethereum $ETH bulls. The SuperTrend on the daily chart has turned green (bullish) for the first time since May last year. This suggests the long period of ‘sideways grind’ is ending, and as long as the $1,800 support holds, a new uptrend could begin.”
Bitmine continues as the sole corporate entity actively expanding its ETH holdings, with aggregate reserves now totaling 4.66 million ETH.