
 Stock: Critical $2,150 Level Holds Key After Failed Rally Attempts")
Key Takeaways
- Ethereum declined 3.4% to $2,287 following its fourth consecutive rejection at the $2,400 resistance threshold
- Daily chart reveals a triple top formation, with $2,150 emerging as critical support territory
- More than $2.5 billion in leveraged long positions vulnerable below $2,150, creating liquidation pressure
- ETH/BTC ratio breached 0.032, indicating underperformance compared to Bitcoin
- Higher timeframe analysis suggests accumulation phase, though breakout confirmation remains pending
Ethereum’s persistent struggle to surpass the $2,400 mark has resulted in four consecutive rejections since April 14, creating a textbook triple top formation across the daily timeframe. Monday’s session saw ETH surrender 3.4% of its value, settling at $2,287 as bulls repeatedly failed to sustain upward momentum.
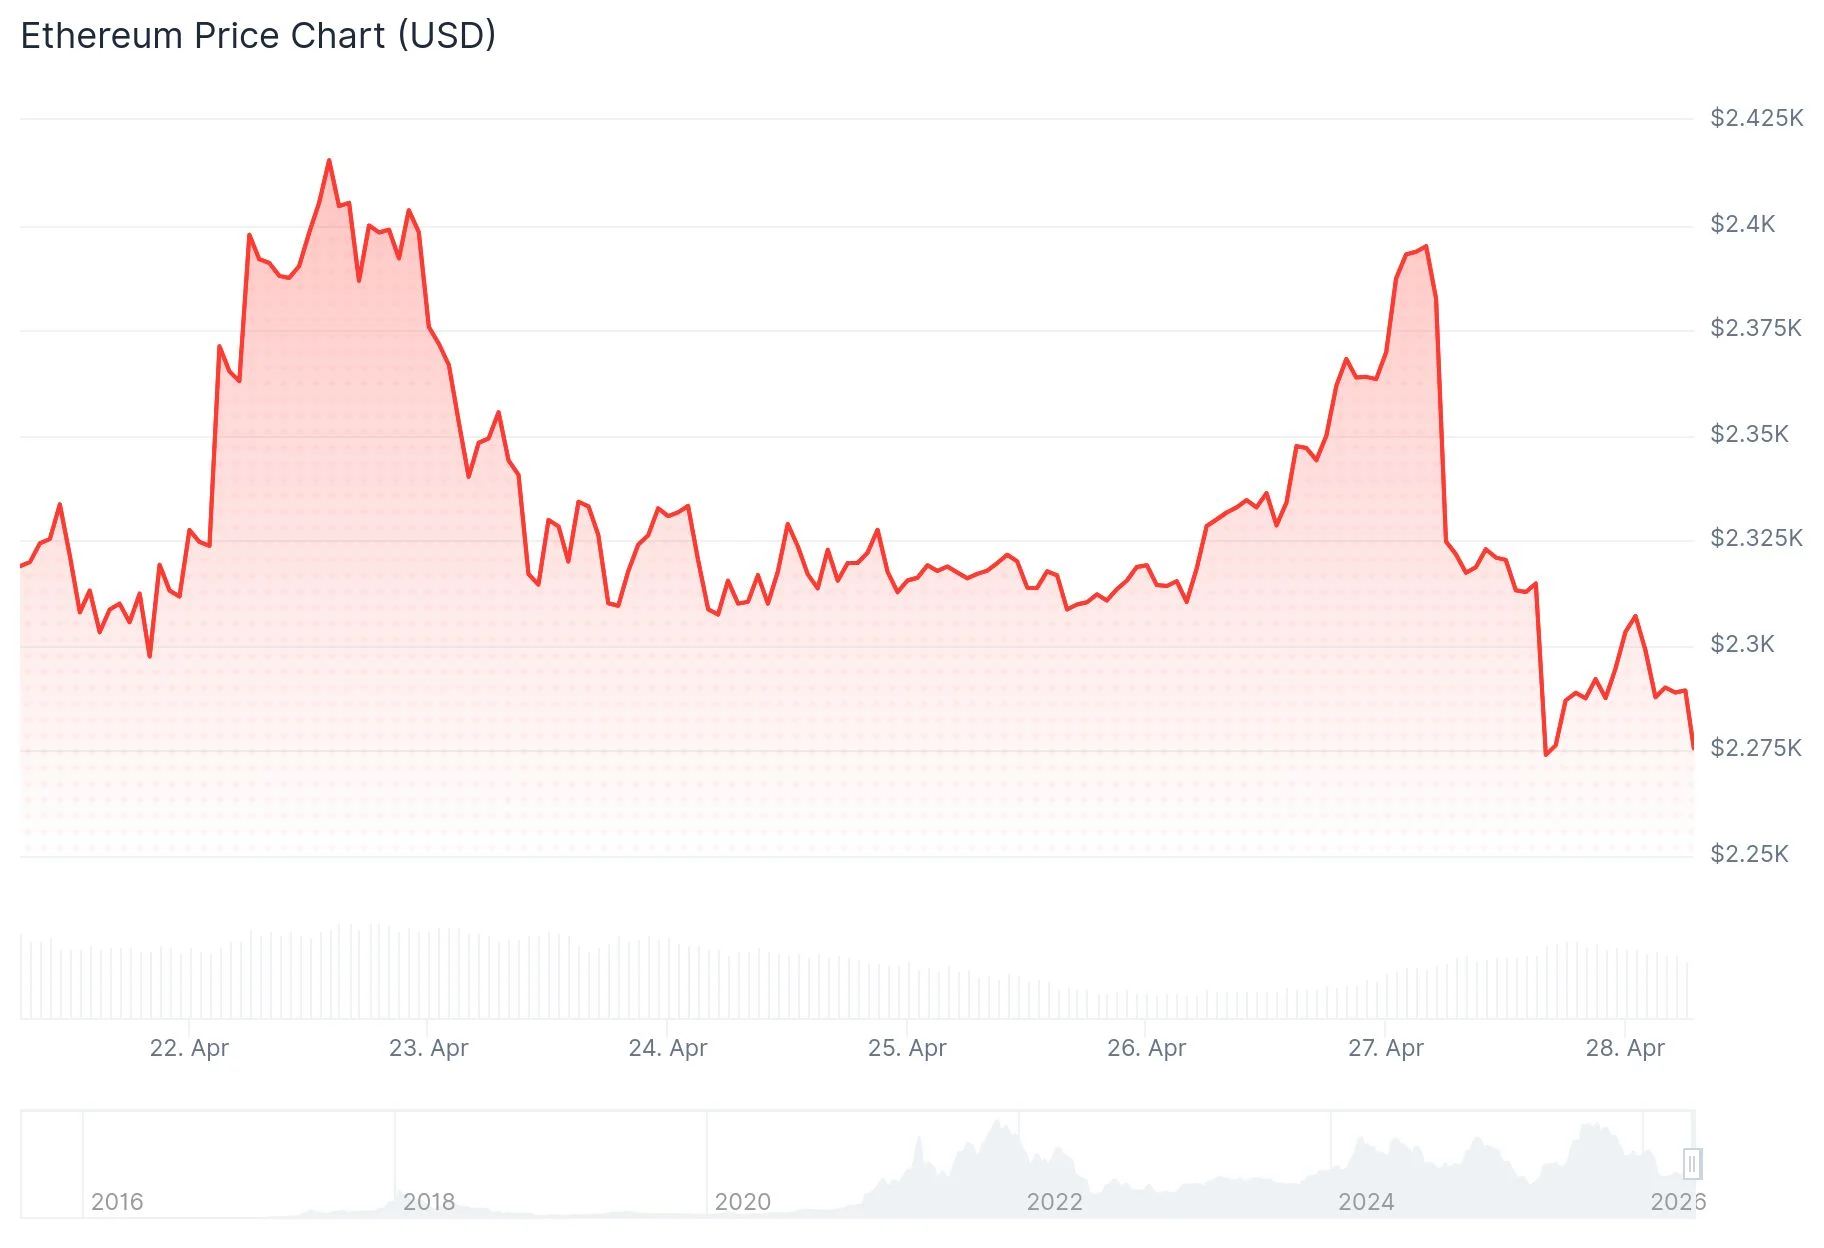
Throughout this consolidation period, the 100-day exponential moving average hovering around $2,350 has served as formidable dynamic resistance. Daily candle closes above this technical indicator remain absent, effectively capping each attempted rally before it can gain traction.
Michaël van de Poppe from MN Capital highlighted concerning weakness in the ETH/BTC trading pair. This ratio tumbled beneath the 0.032 BTC threshold, violating a support structure that had previously provided foundation for continuation patterns. Additionally, the ratio dropped below its 21-period moving average, signaling deteriorating performance relative to Bitcoin.
For the ETH/BTC pair on higher timeframes, the subsequent support zone lies around 0.026 BTC, a level where historical buying pressure has materialized.

Critical $2,150 Zone Commands Attention
The $2,150 price point has emerged as the pivotal level demanding trader focus. This zone previously functioned as resistance before converting to support through a technical flip. Should this level fail to hold, the pathway opens toward the $2,050 to $1,900 range.
CoinGlass liquidation metrics reveal over $2.5 billion worth of leveraged long positions clustered immediately beneath $2,150. A decisive breach of this threshold would likely cascade into forced liquidations across the market.
On Binance exchange, Ether’s open interest has contracted to $2.58 billion, mirroring levels observed when ETH traded around $2,200 earlier in the month. The funding rate has dropped to approximately -0.013%, representing its lowest reading since February, with short-biased positions now leading fresh market activity.
Analyst Amr Taha observed that this configuration—diminished leverage paired with short-heavy positioning—creates potential for a price squeeze should ETH maintain stability around current price levels.
Higher Timeframe Analysis Points to Accumulation
Crypto Patel published a two-week chart on X illustrating Ethereum positioned near the lower boundary of an extended rising channel structure. The $1,700 to $2,250 range is identified as a liquidity absorption and accumulation zone, functioning as macro support since 2022.
Immediate resistance beyond current pricing exists around $2,480, with subsequent resistance spanning $3,500 to $4,900, encompassing the prior all-time high region near $4,876.
A complementary three-day chart from James Easton on X demonstrates a recurring pattern where significant rallies emerged following substantial retracements. A white marker indicates the current 2026 low point, hinting that ETH may be constructing another accumulation base.
Neither chart provides definitive confirmation of an impending rally. Ethereum must defend the accumulation zone and recapture $2,480 before any constructive technical narrative gains credibility.
The decisive battleground remains at $2,150, where technical support converges with substantial liquidation exposure on the daily chart.