
 Stock: Critical $2,040 Support at Risk as Head and Shoulders Pattern Emerges")
Quick Overview
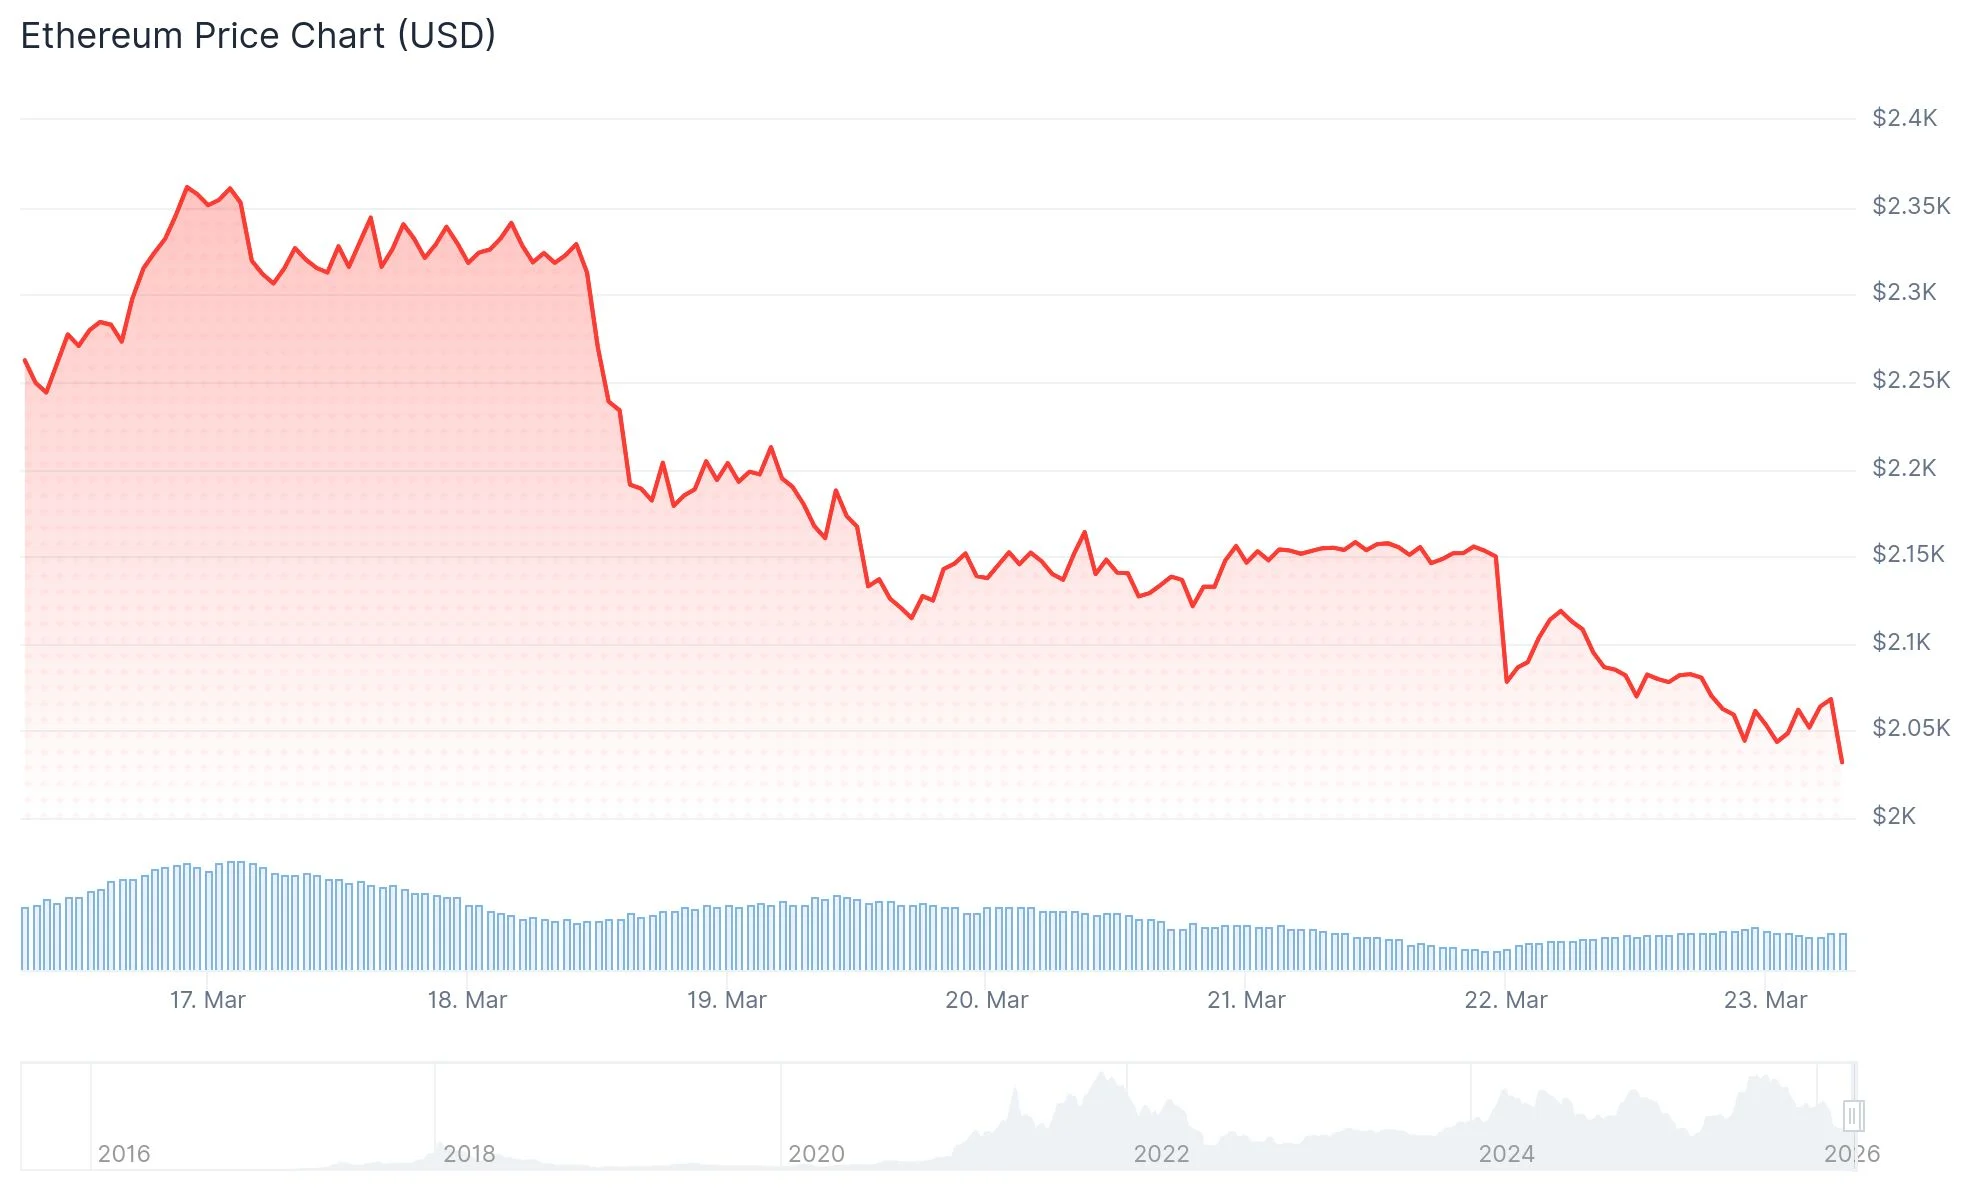
- Ethereum slipped beneath $2,220 before bottoming at $2,025, currently ranging between $2,020–$2,100
- Dual bearish trendlines have emerged, creating resistance zones at $2,120 and $2,165
- Clearing $2,165 resistance may trigger a rally toward $2,200–$2,300; losing $2,025 support could accelerate selling to $2,000 or below
- Last week’s spot ETF activity showed combined net outflows totaling $59.94 million, with BlackRock’s ETHA accounting for $69.59 million
- Collective net assets across Ethereum spot ETFs currently total $12.33 billion, representing a 4.79% ratio of Ethereum’s market capitalization
Ethereum experienced significant downward pressure during the latest trading session, plummeting from approximately $2,385 down to $2,025. Currently, ETH is changing hands beneath the $2,100 threshold and trading below its 100-hourly Simple Moving Average.
The selloff initiated when ETH couldn’t maintain ground above the $2,220 mark. Price action subsequently breached both $2,150 and $2,120 levels, ultimately touching a temporary bottom just under $2,050.
Presently, ETH remains in consolidation mode beneath the 23.6% Fibonacci retracement of its recent descent from $2,385 to $2,025. Technical chart analysis reveals two descending trendlines on the hourly timeframe, establishing resistance barriers at the $2,120 and $2,165 price points.
The immediate resistance hurdle stands at $2,120, which coincides with the 100-hourly Simple Moving Average. Successfully pushing above this threshold would bring the $2,165 level into consideration as the subsequent target.

Should Ethereum manage to breakthrough $2,165, the 50% Fibonacci retracement marker positioned around $2,200 becomes the next focal point. Sustained momentum beyond this area could potentially drive prices toward $2,250 or even $2,300.
Critical Support Zones Under Watch
Looking at potential downside scenarios, the nearest support cushion appears around $2,040. Beneath this level, the $2,025 region represents the primary support foundation.
A decisive breakdown below $2,025 would shift attention toward the psychological $2,000 threshold. Additional weakness beyond that point could expose the $1,965 level, with more substantial support positioned at $1,880.
Technical analyst Ted Pillows shared his observations on X regarding a developing chart formation. His commentary stated: “$ETH seems to be forming head and shoulder pattern. If Ethereum loses the $2,040 level, expect a massive dump.”
ETF Activity Contributes to Bearish Sentiment
Ethereum spot exchange-traded funds registered combined net outflows amounting to $59.94 million during the March 16–20 trading week, based on SoSoValue statistics highlighted by PANews on March 23.
BlackRock’s ETHA product dominated weekly outflow activity, experiencing withdrawals totaling $69.59 million throughout the period. Despite last week’s exodus, ETHA maintains a cumulative historical net inflow of $11.91 billion.
Fidelity’s FETH product similarly witnessed capital departures of $61.62 million during the identical timeframe. The fund’s aggregate historical net inflow remains positioned at $2.32 billion.
The sole exception to last week’s outflow trend was Grayscale’s Ethereum Mini Trust (ETH), which attracted $6.87 million in fresh capital. This product has accumulated $1.85 billion in historical total net inflows.
Current data through March 23 indicates that aggregate net assets held within Ethereum spot ETFs amount to $12.33 billion, accounting for 4.79% of Ethereum’s overall market capitalization. The combined historical cumulative net inflow figure across all Ethereum ETF products stands at $11.73 billion.