
 Stock: Critical $1,700 Support Level Under Scrutiny as Resistance Mounts")
Key Takeaways
- Open interest in Ethereum futures contracts has declined by approximately 2 million ETH since the end of May.
- Perpetual funding rates have alternated between positive and negative territory, indicating uncertainty from both long and short traders.
- Price action remains confined within a narrow $1,741-$1,806 corridor, with the 20-day exponential moving average around $1,794 presenting overhead resistance.
- US spot Ethereum ETFs registered positive flows once more, though Tuesday’s inflows remained relatively modest at $9.6 million.
- Market analyst Ted Pillows highlighted the $1,700-$1,750 range as the critical support zone that needs to hold.
Ethereum (ETH) hovered around the $1,740 level as derivatives market activity remained subdued following the recent market correction. Current metrics indicate continued hesitation among traders after ETH plunged beneath $1,600 earlier in June.
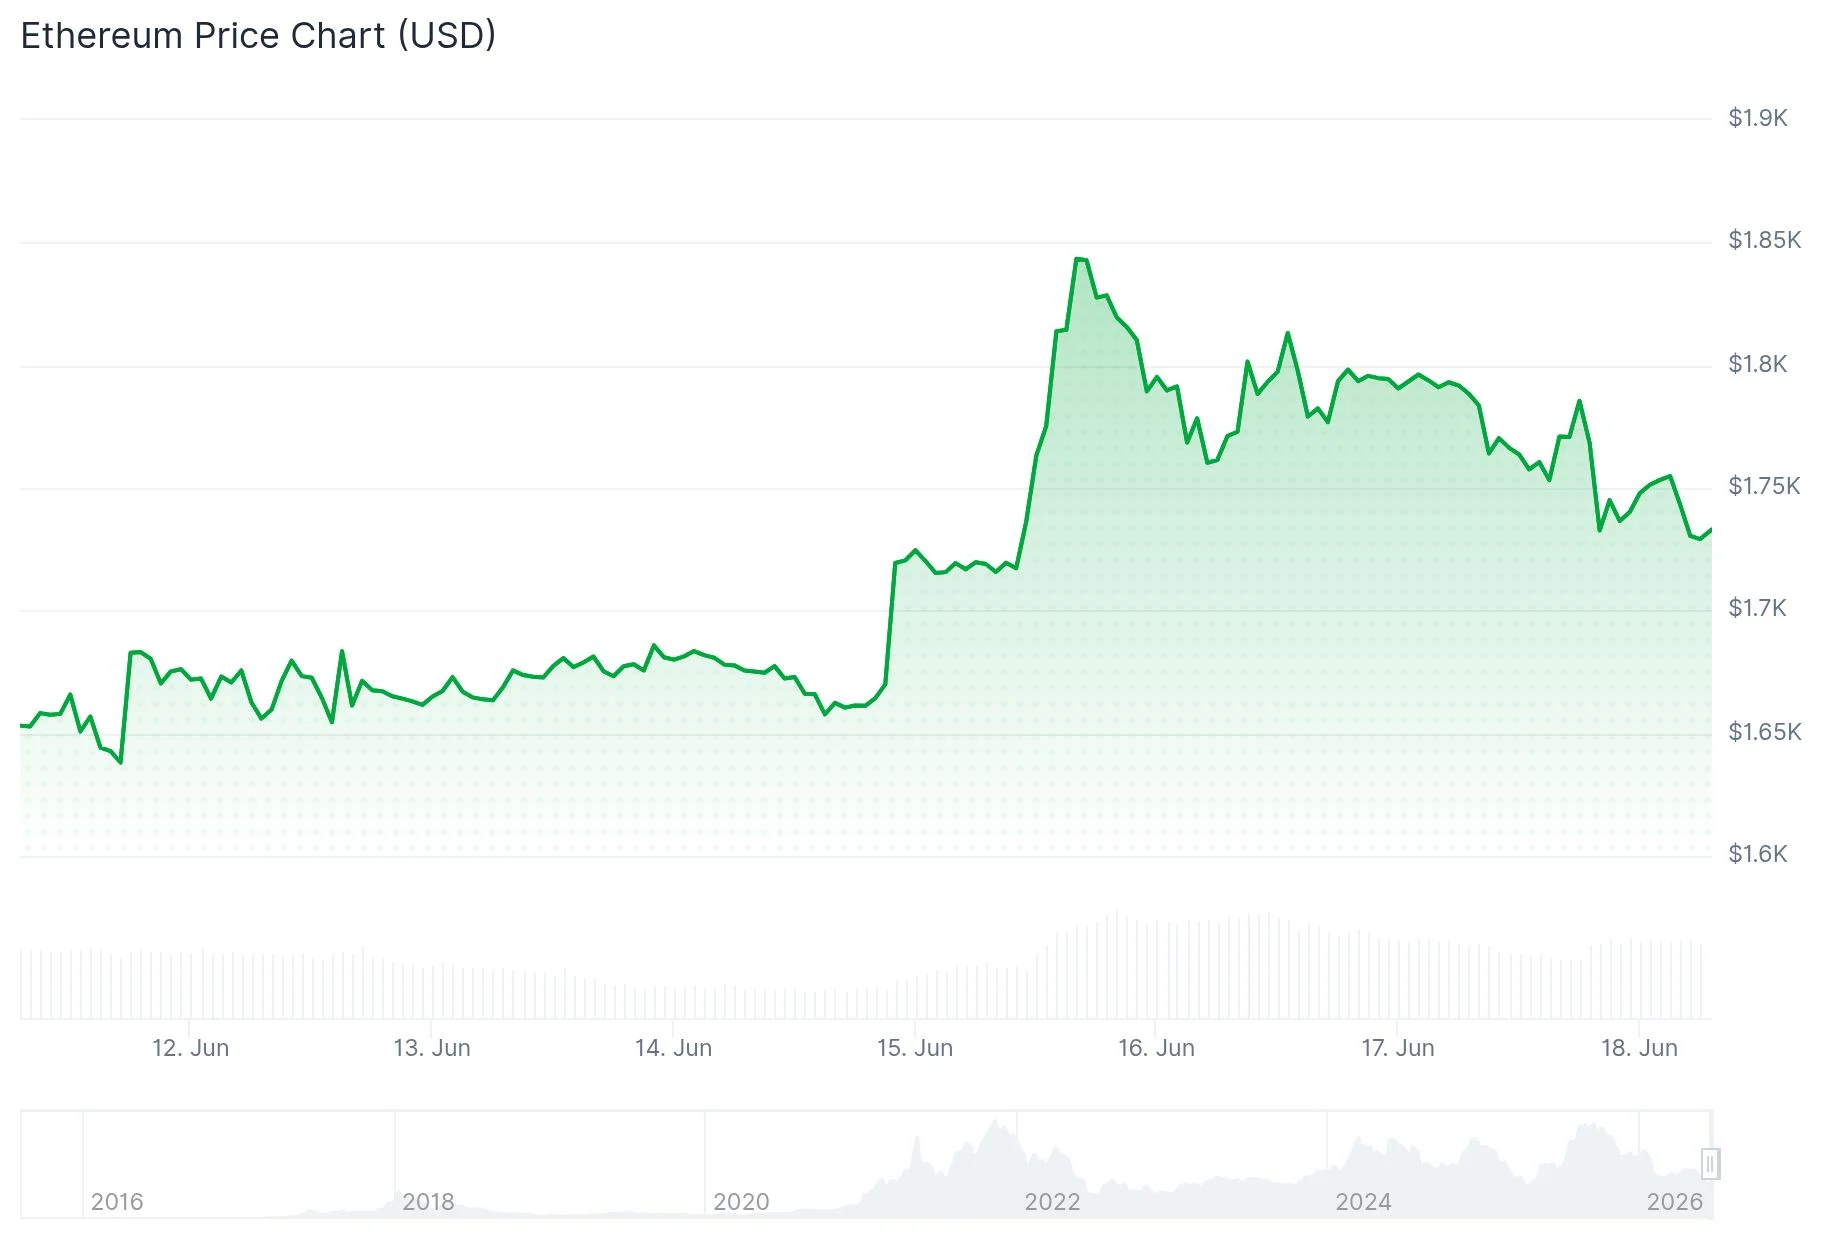
Open interest across Ethereum futures markets contracted to 13.64 million ETH by Sunday, marking the lowest reading since the beginning of May. A modest rebound materialized following Monday’s price recovery above the $1,700 threshold.
From May 28 through the present, approximately 2 million ETH in futures capital has exited the market. This exodus signals a growing risk-averse sentiment among leveraged market participants.
Perpetual contract funding rates have similarly painted a picture of indecision. Throughout the previous two weeks, these rates have oscillated between negative and positive territory.

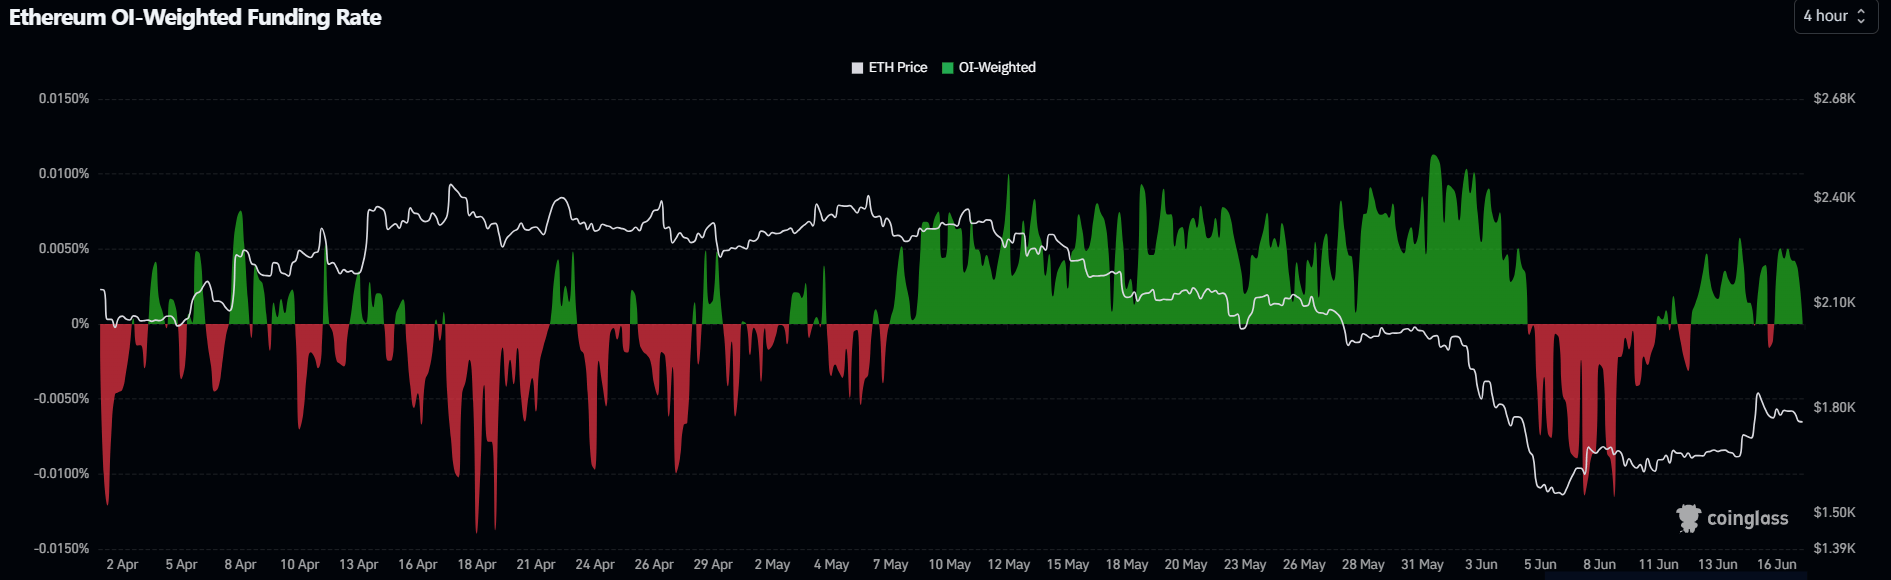
This back-and-forth movement indicates that neither bullish nor bearish traders have established dominance. The pattern emerges after substantial long position liquidations swept through markets during the final days of May and the opening days of June.
Meanwhile, exchange reserve balances saw a marginal decrease over the last 48 hours. US-based spot Ethereum ETF products recorded their second consecutive day of positive flows, accumulating $9.6 million on Tuesday.
Key resistance levels loom above current price
Despite these marginal improvements, the broader data landscape continues to reflect tepid market conviction. Neither retail participants nor institutional investors have demonstrated a decisive directional preference.
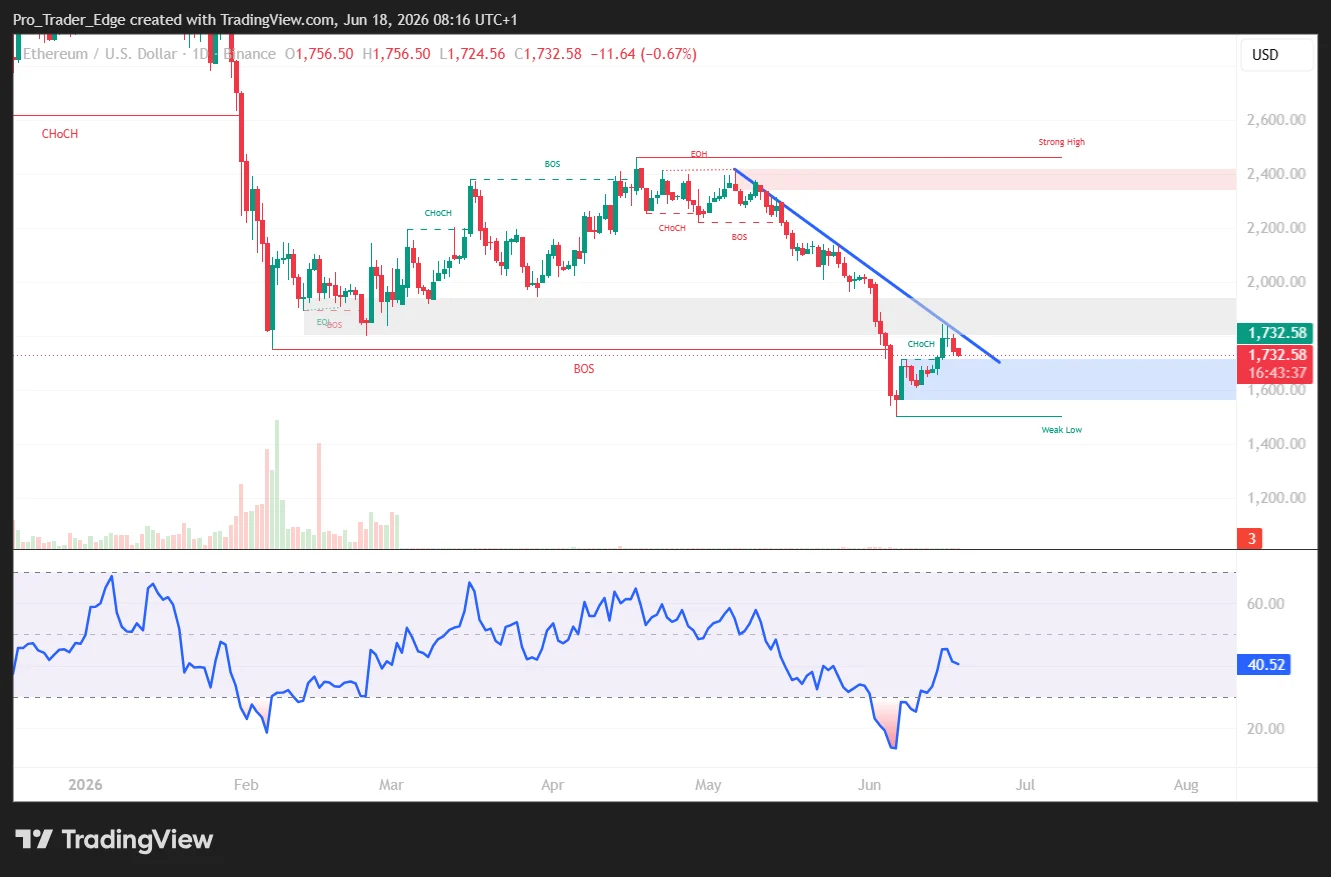
Technical analysis of the daily timeframe reveals ETH trading beneath its 20-day, 50-day, and 100-day exponential moving averages. These technical indicators form a cluster ranging from approximately $1,794 through $2,109.
The most immediate overhead barrier sits at the 20-day EMA around $1,794. Beyond that level, market participants are monitoring the horizontal resistance zone at $1,806.
Should ETH manage to break through these barriers, additional resistance awaits at $1,909, $1,955, and $2,019. The 100-day EMA positioned near $2,108 represents another significant ceiling that may cap upside momentum.
Downside support zone takes center stage
Looking at potential downside targets, the nearest support level rests around $1,741. Below that threshold, traders are watching $1,524, $1,405, and ultimately $1,156.
Additional market commentary has emphasized the importance of the $1,700-$1,750 region. Analysis suggests that a decisive breach below $1,700 could elevate the probability of a move toward price levels beneath $1,500.
Market analyst Ted Pillows noted that Ethereum has slipped below the $1,800 mark and emphasized that the $1,700-$1,750 support range must hold firm to enable another upward move, warning that failure could push Ethereum toward sub-$1,500 territory.
Market observers have noted that Federal Reserve policy signals and subdued trading volumes may influence ETH price behavior heading into the June month-end close. The current technical picture remains well-defined: Ethereum continues to trade within a compressed range, facing resistance between $1,794 and $1,806 while finding support around $1,741 and the broader $1,700-$1,750 zone.