
 Stock: Accumulation Wallets Surge 33% as $3,000 Target Emerges")
Key Highlights
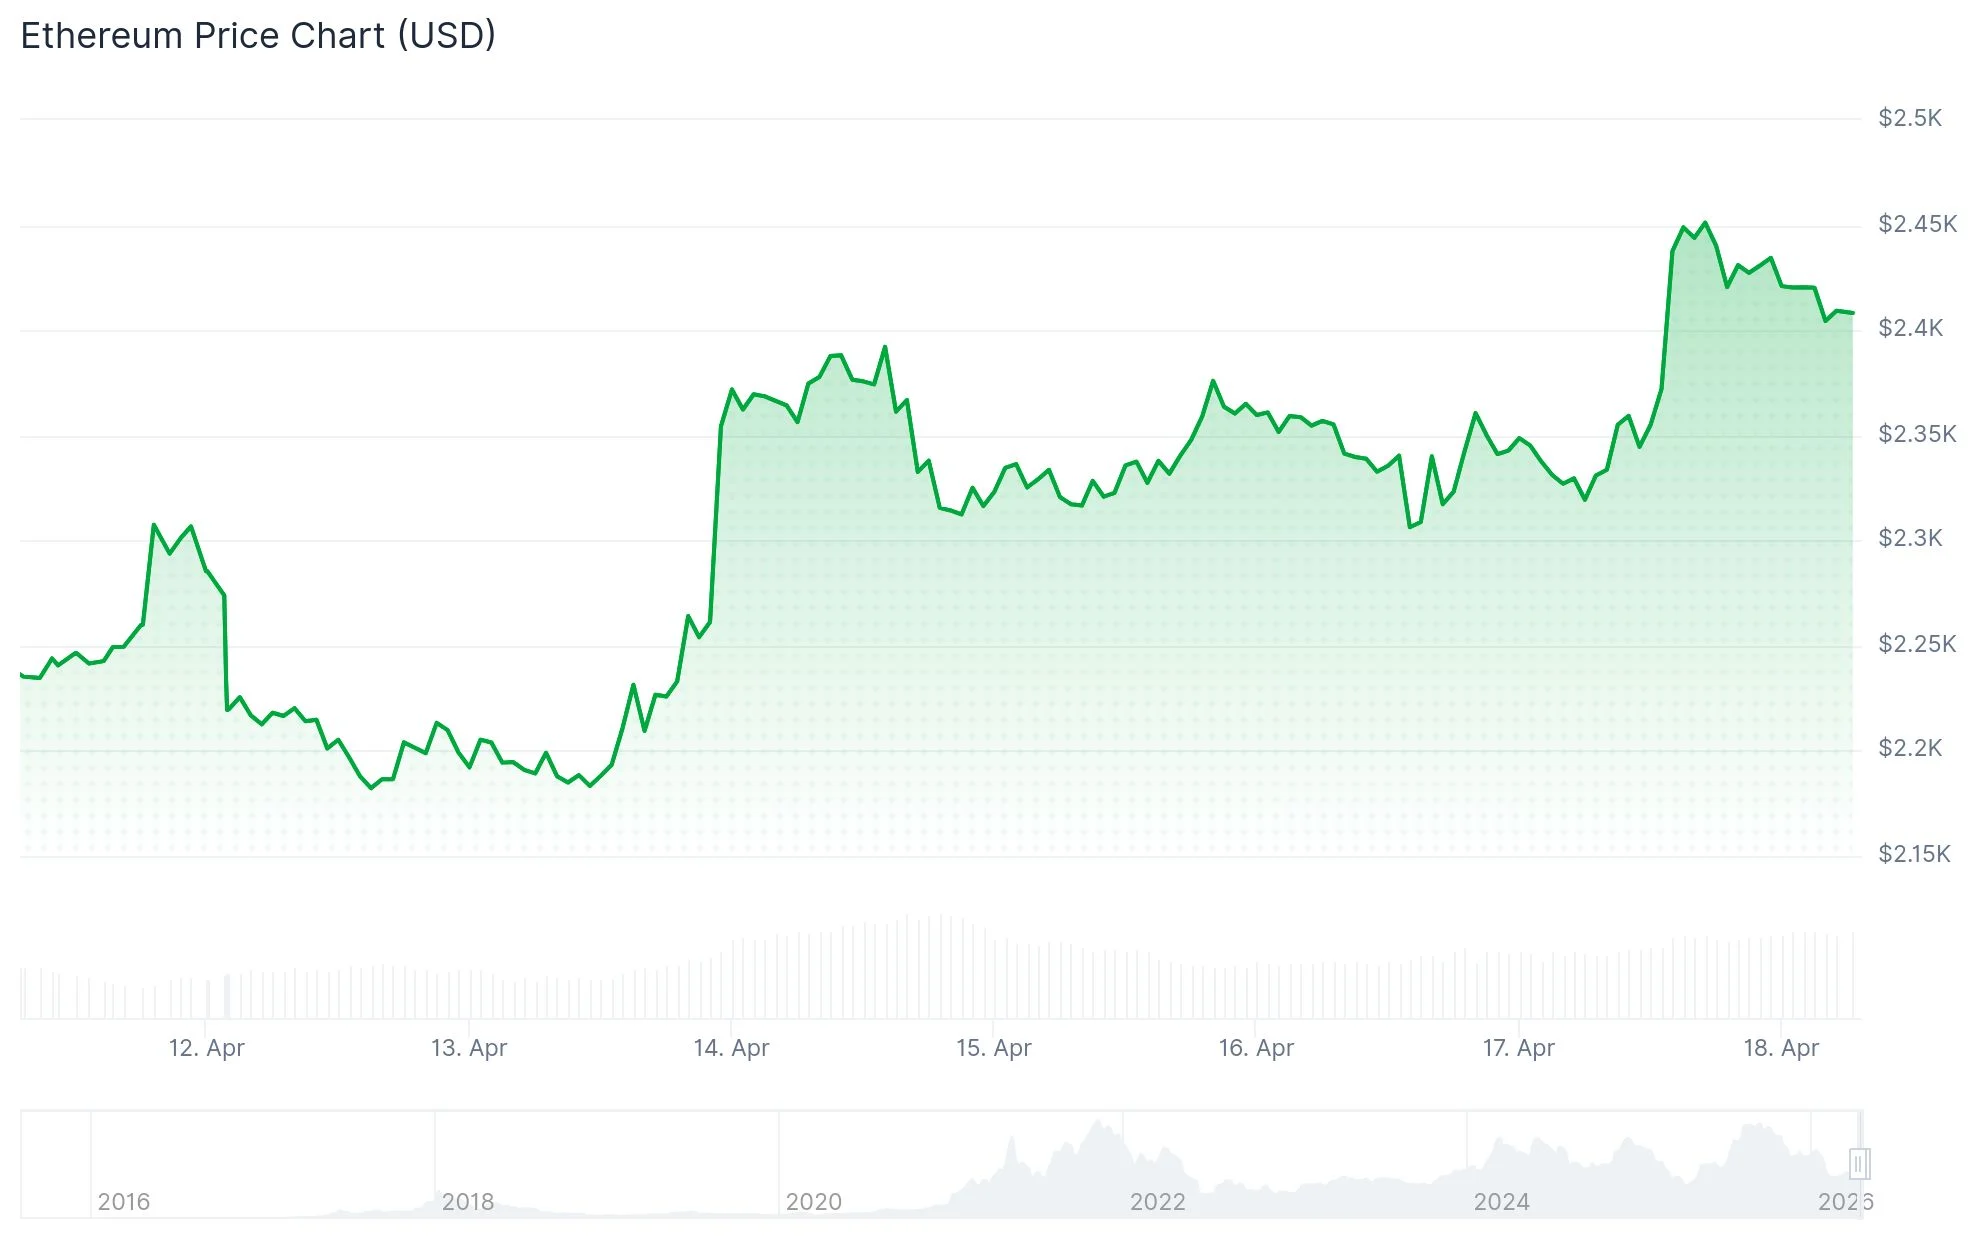
- ETH has surged past $2,400, marking a 38% gain from its recent $1,750 low
- Wallets dedicated to accumulation increased their holdings by 33%, acquiring 6.5 million ETH since the start of the year
- Technical analysis reveals a cup-and-handle formation with price objectives between $2,960 and $3,150
- Ethereum spot ETFs recorded $298.4 million in net inflows across seven trading days
- Reduced geopolitical tensions following Iran’s Strait of Hormuz announcement provided additional price support
Ethereum’s price has broken through the $2,400 threshold, extending a rebound that began at $1,750. This rally represents approximately a 38% increase from that recent bottom. Multiple indicators from on-chain metrics and technical chart analysis are capturing the attention of market participants.
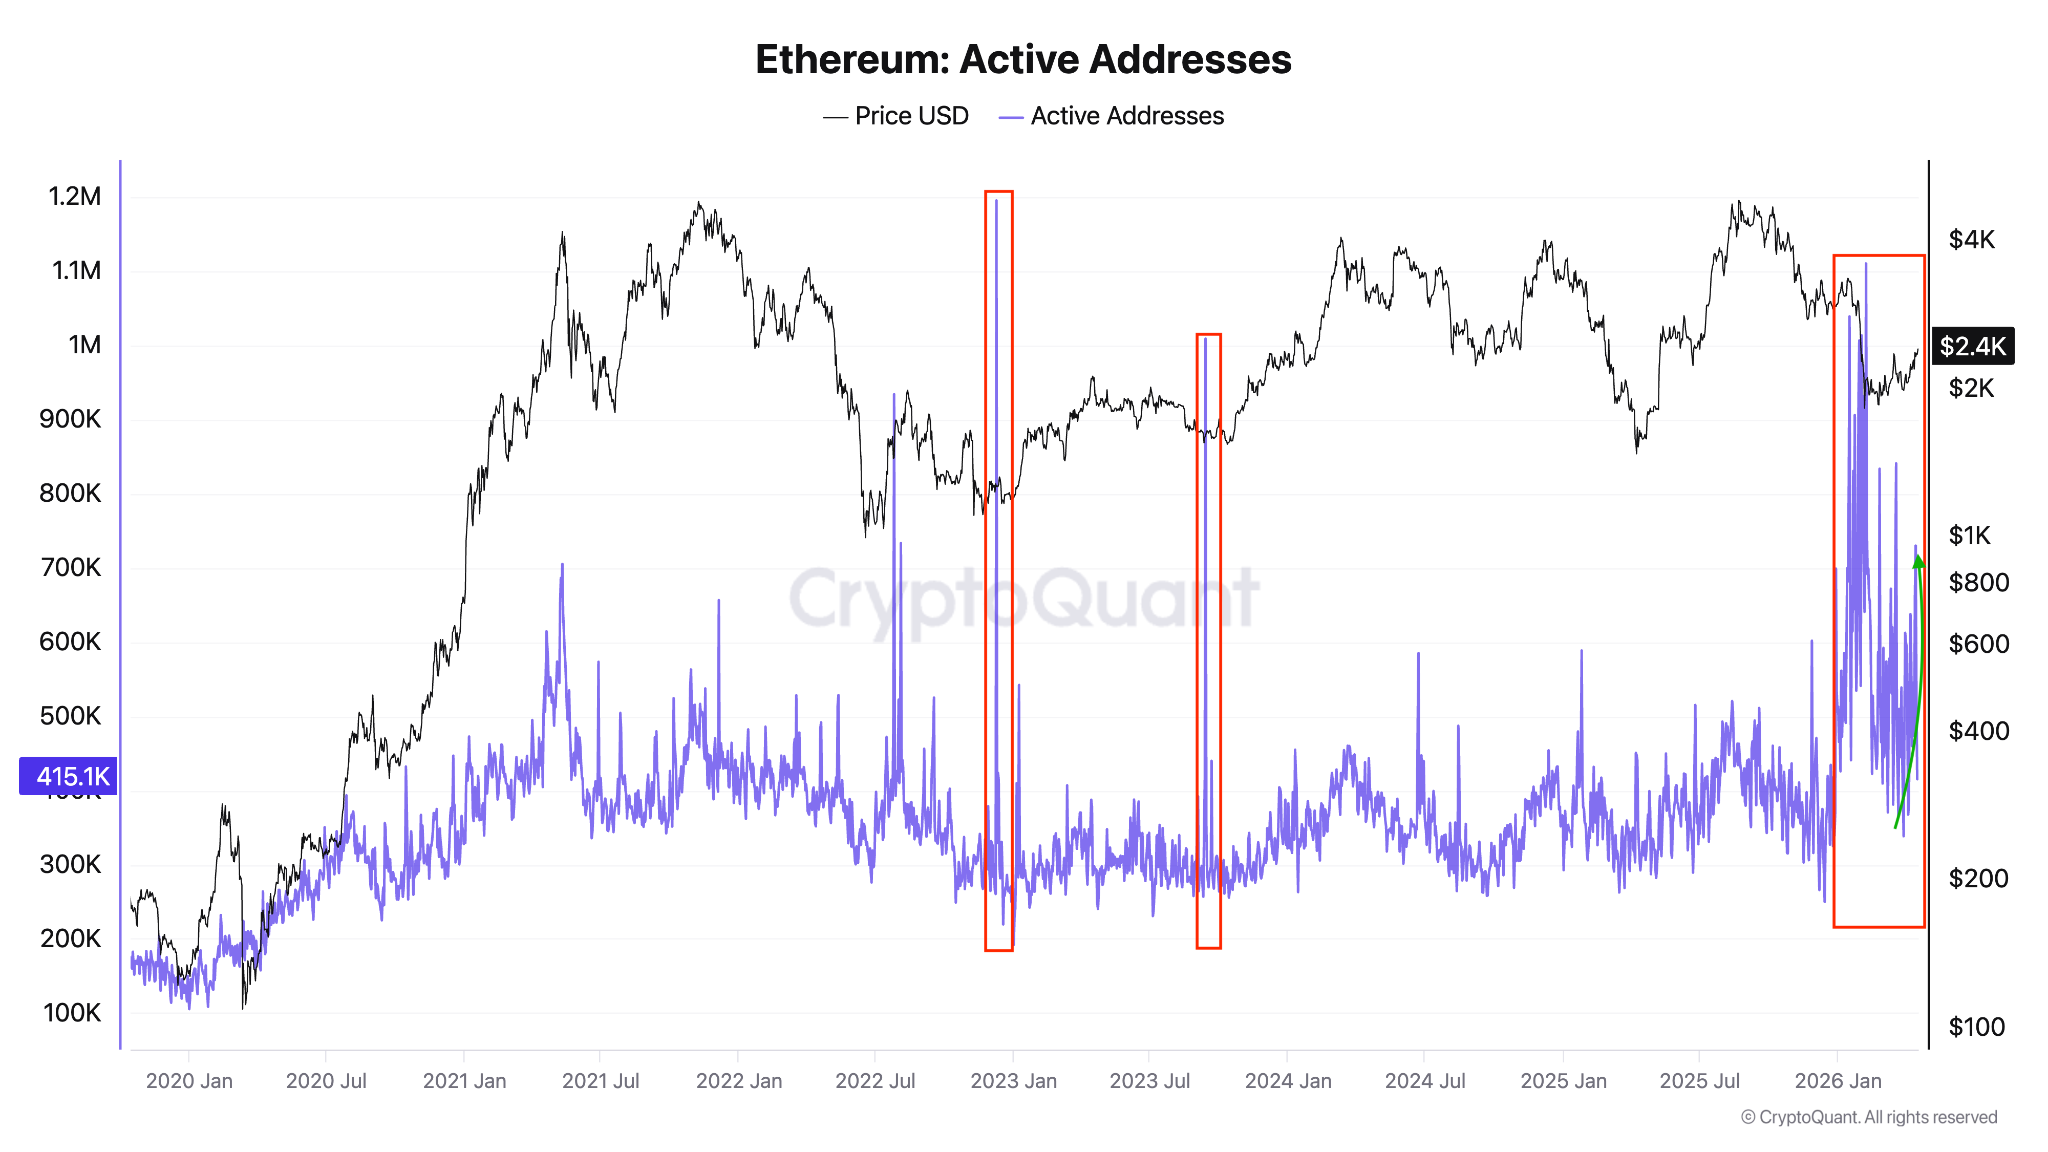
Active addresses on the Ethereum network experienced an 89% surge on April 5, climbing from 384,763 to 730,278. Historical data shows similar spikes in network activity have coincided with local market bottoms, notably during 2022 before subsequent price advances.
Accumulation addresses reached a record daily inflow of 1.14 million ETH in November 2025. Throughout 2026, these addresses have maintained an average intake of 200,000 ETH daily, with a notable jump to 358,000 ETH recorded on Thursday.
The cumulative ETH held in accumulation-focused wallets—defined as addresses with zero selling history—has expanded from 19.64 million to 26.16 million ETH since the beginning of January. This represents a 33% surge in holdings.

Currently, 39.2 million ETH is locked in staking contracts. Meanwhile, ETH reserves across centralized exchanges have declined to levels not seen in years, constraining the available supply for immediate trading.
Technical Chart Formation Suggests $3,150 Upside
From a technical perspective, ETH has completed a breakout from a cup-and-handle structure visible on the 12-hour timeframe. A decisive close above the $2,400 neckline establishes a projected target around $2,960. The 14-day Relative Strength Index currently reads between 65 and 68, indicating positive momentum.
Analyst TheSkayeth highlighted a more extensive cup-and-handle formation developing over a two-month period on the daily chart. According to this trader, ETH is “setting up for a massive move,” with the pattern’s completion potentially pushing prices into the “golden zone.” The calculated target from this broader pattern extends to $3,150.
Sustained ETF Capital Flows Reflect Growing Institutional Appetite
Spot Ethereum exchange-traded funds have registered uninterrupted net inflows for seven consecutive trading sessions, accumulating $298.4 million according to SoSoValue tracking. April 17 alone witnessed $127 million flowing into spot Ethereum ETFs, as reported by Wu Blockchain.
Ethereum received an additional boost from diminishing geopolitical risks. Iran’s decision to reopen the Strait of Hormuz, following ceasefire progress involving the United States and Lebanon, helped improve market sentiment. ETH now trades above its on-chain average acquisition cost of $2,308.
The Moving Average Convergence Divergence (MACD) indicator on ETH’s weekly timeframe has formed a golden cross—a bullish signal that historically preceded price reversals in November 2024 and May 2025.
Open interest across Ethereum derivatives markets has risen to 14.67 million ETH. Funding rates have shifted into negative territory, indicating short sellers are establishing positions in anticipation of consolidation. Within the last 24 hours, liquidations totaled $163.2 million in ETH contracts, with $140.9 million attributed to short positions.
Immediate price support for ETH is located at the 100-day exponential moving average around $2,378. Overhead resistance levels appear at $2,746, followed by a more substantial barrier at $3,411.