
 Stock Skyrockets 53% as Futures Interest Hits All-Time High")
Key Highlights
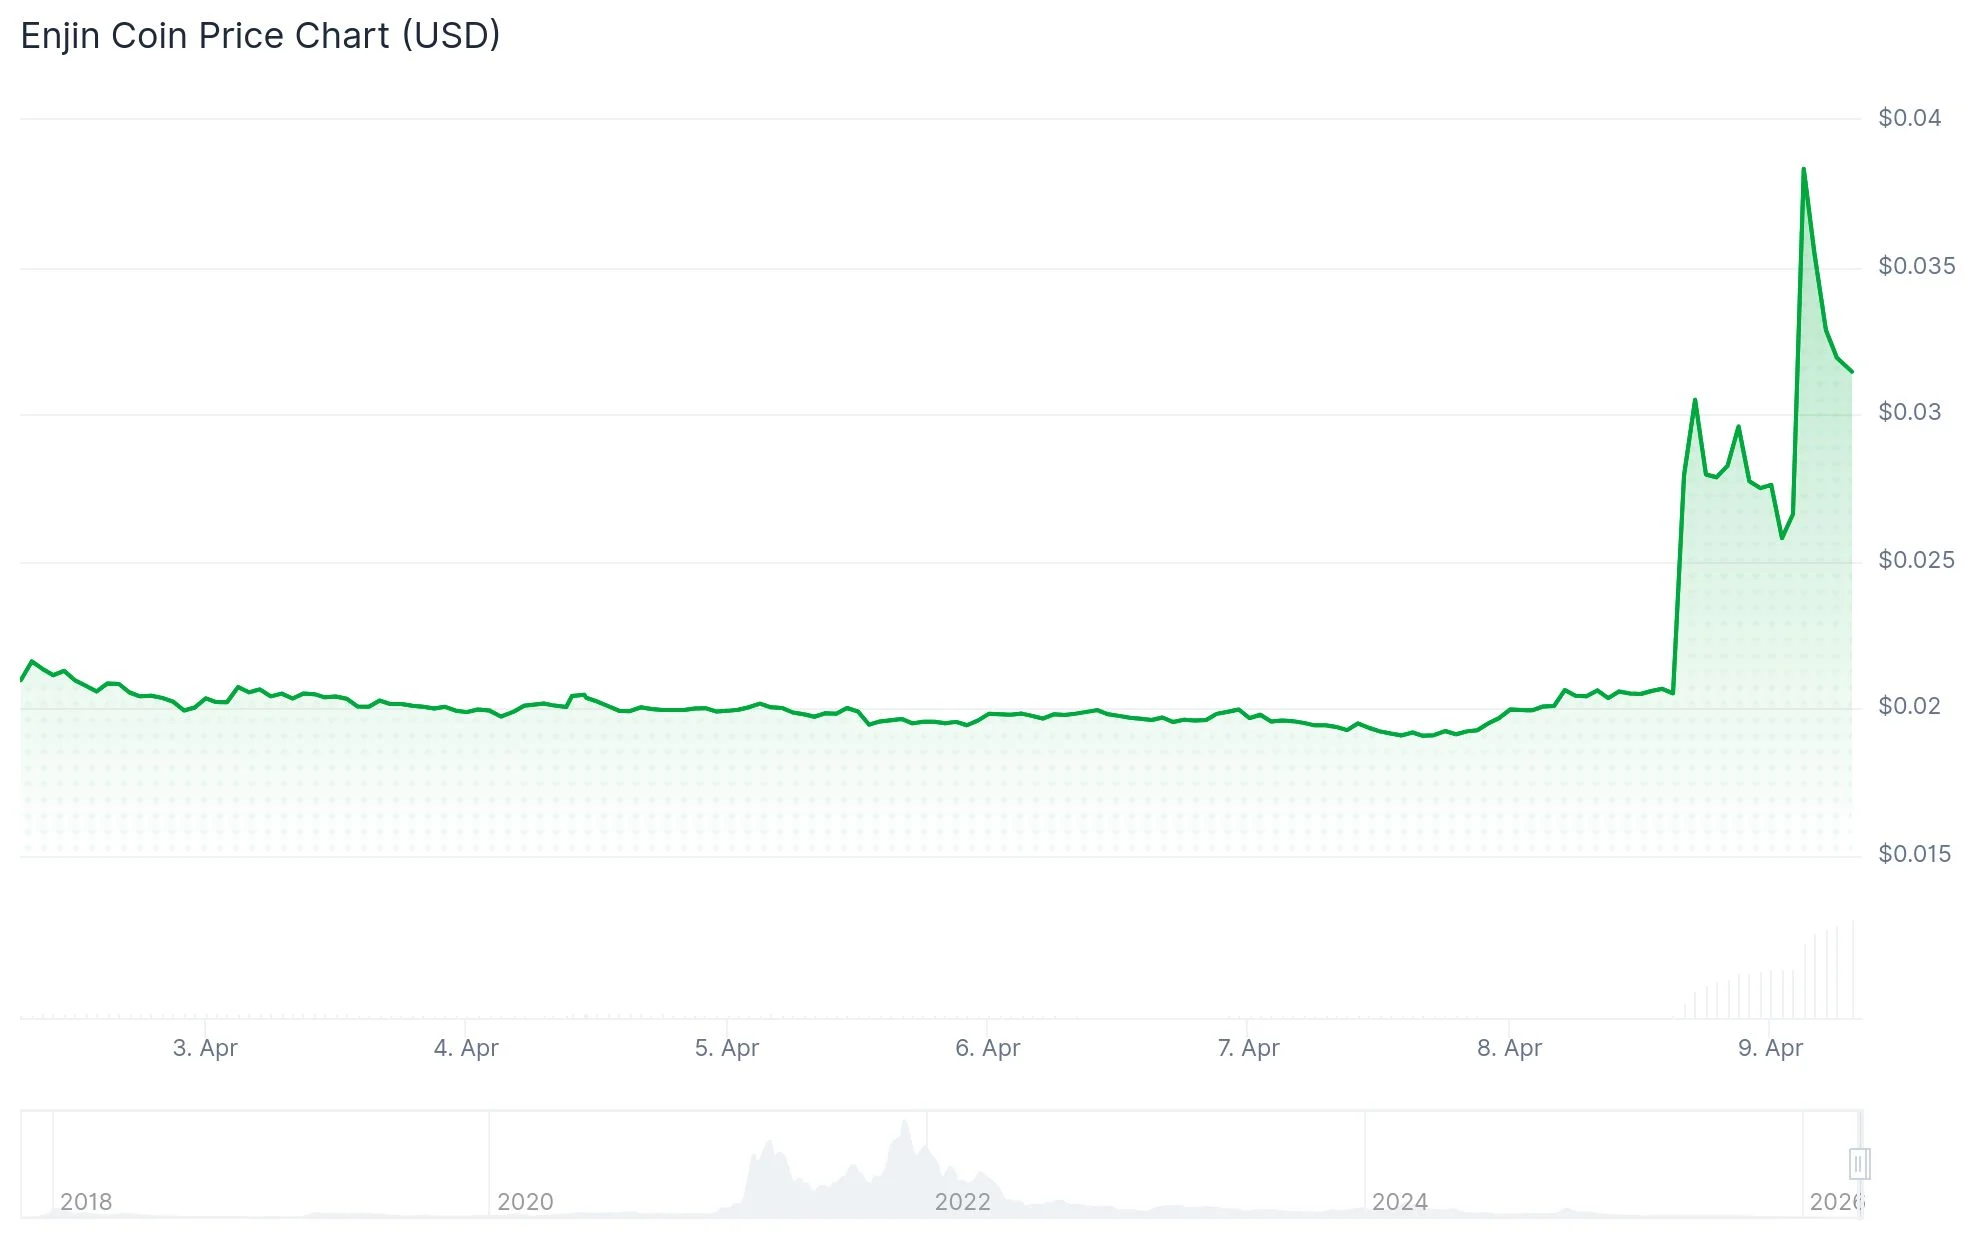
- ENJ rallied more than 53% within a 24-hour period, reaching price levels between $0.029 and $0.035
- Trading volume surged to $105–$216 million in 24 hours, significantly exceeding typical levels
- Futures open interest climbed to an all-time high of $74.68 million from $19.82 million just two days earlier
- Price increases were uniform across 56 trading pairs, indicating authentic market demand
- The RSI indicator approached 82, reflecting overbought territory that may limit further upside
Enjin Coin (ENJ) delivered one of its most dramatic single-session rallies in recent history, climbing more than 53% in just 24 hours. The cryptocurrency was changing hands between $0.029 and $0.035 across various exchanges and time intervals, with minor discrepancies between different data providers.
What made this surge particularly noteworthy was its occurrence during a period when Bitcoin posted only marginal advances. This divergence indicates that ENJ-specific catalysts, rather than broader cryptocurrency market momentum, fueled the buying pressure.
Volume metrics painted a compelling picture. According to Santiment analytics, ENJ’s ecosystem registered $216.97 million in trading volume on Thursday — marking the highest level observed since April 2025. Meanwhile, MEXC exchange data showed $105.7 million in 24-hour volume against a market capitalization of merely $57.8 million.

This translates to a volume-to-market-cap ratio ranging from approximately 1.8x to 2.1x. For context, stable markets generally maintain ratios between 0.1x and 0.5x.

Futures Market Activity Reaches Unprecedented Levels
Derivatives market metrics further validated the bullish momentum. Data from CoinGlass revealed that ENJ futures open interest surged to $74.68 million on Thursday, representing a substantial jump from the $19.82 million recorded on Tuesday. Expanding open interest typically indicates fresh capital flowing into the market.

The rally also demonstrated remarkable consistency. Examining 56 different trading pairs, ENJ posted gains ranging from 37.97% to 43.68%, with a standard deviation of merely 1.8 percentage points. Such uniformity strongly suggests widespread demand rather than isolated exchange-specific activity.
From a technical analysis perspective, ENJ reclaimed positions above both its short-term and medium-term exponential moving averages. The 200-day EMA hovering near $0.035 represents the next significant resistance barrier. The daily chart’s RSI indicator registered near 82, indicating overbought market conditions.
The MACD histogram shifted decisively positive, confirming bullish near-term momentum. Should ENJ maintain support above the 23.6% Fibonacci retracement at $0.031, subsequent targets include $0.051, $0.066, and $0.082.
Blockchain Metrics and Warning Indicators
Blockchain activity metrics revealed a network growth index reaching 71, the highest reading since August 2025. Large holder activity also intensified, with whale wallet engagement climbing in tandem with price appreciation.
Nonetheless, CryptoQuant analytics identified preliminary indicators of potential buyer fatigue. Futures market data suggested increasing retail participation accompanied by negative sentiment readings, while sell-side pressure became apparent across both spot and derivatives markets.
ENJ currently ranks approximately #406–#416 by market capitalization, dramatically lower than its top-50 standing during the 2021 NFT market peak. Its current market cap of roughly $54–$58 million remains approximately 94% beneath its historical all-time high.
The critical price zone to monitor spans $0.033 to $0.038 resistance. A convincing breakout above this range could pave the way for additional upside, whereas a decline below $0.025 might catalyze a more pronounced correction.