
 Stock: Massive Breakout Potential as Multi-Year Pattern Nears Completion")
Key Takeaways
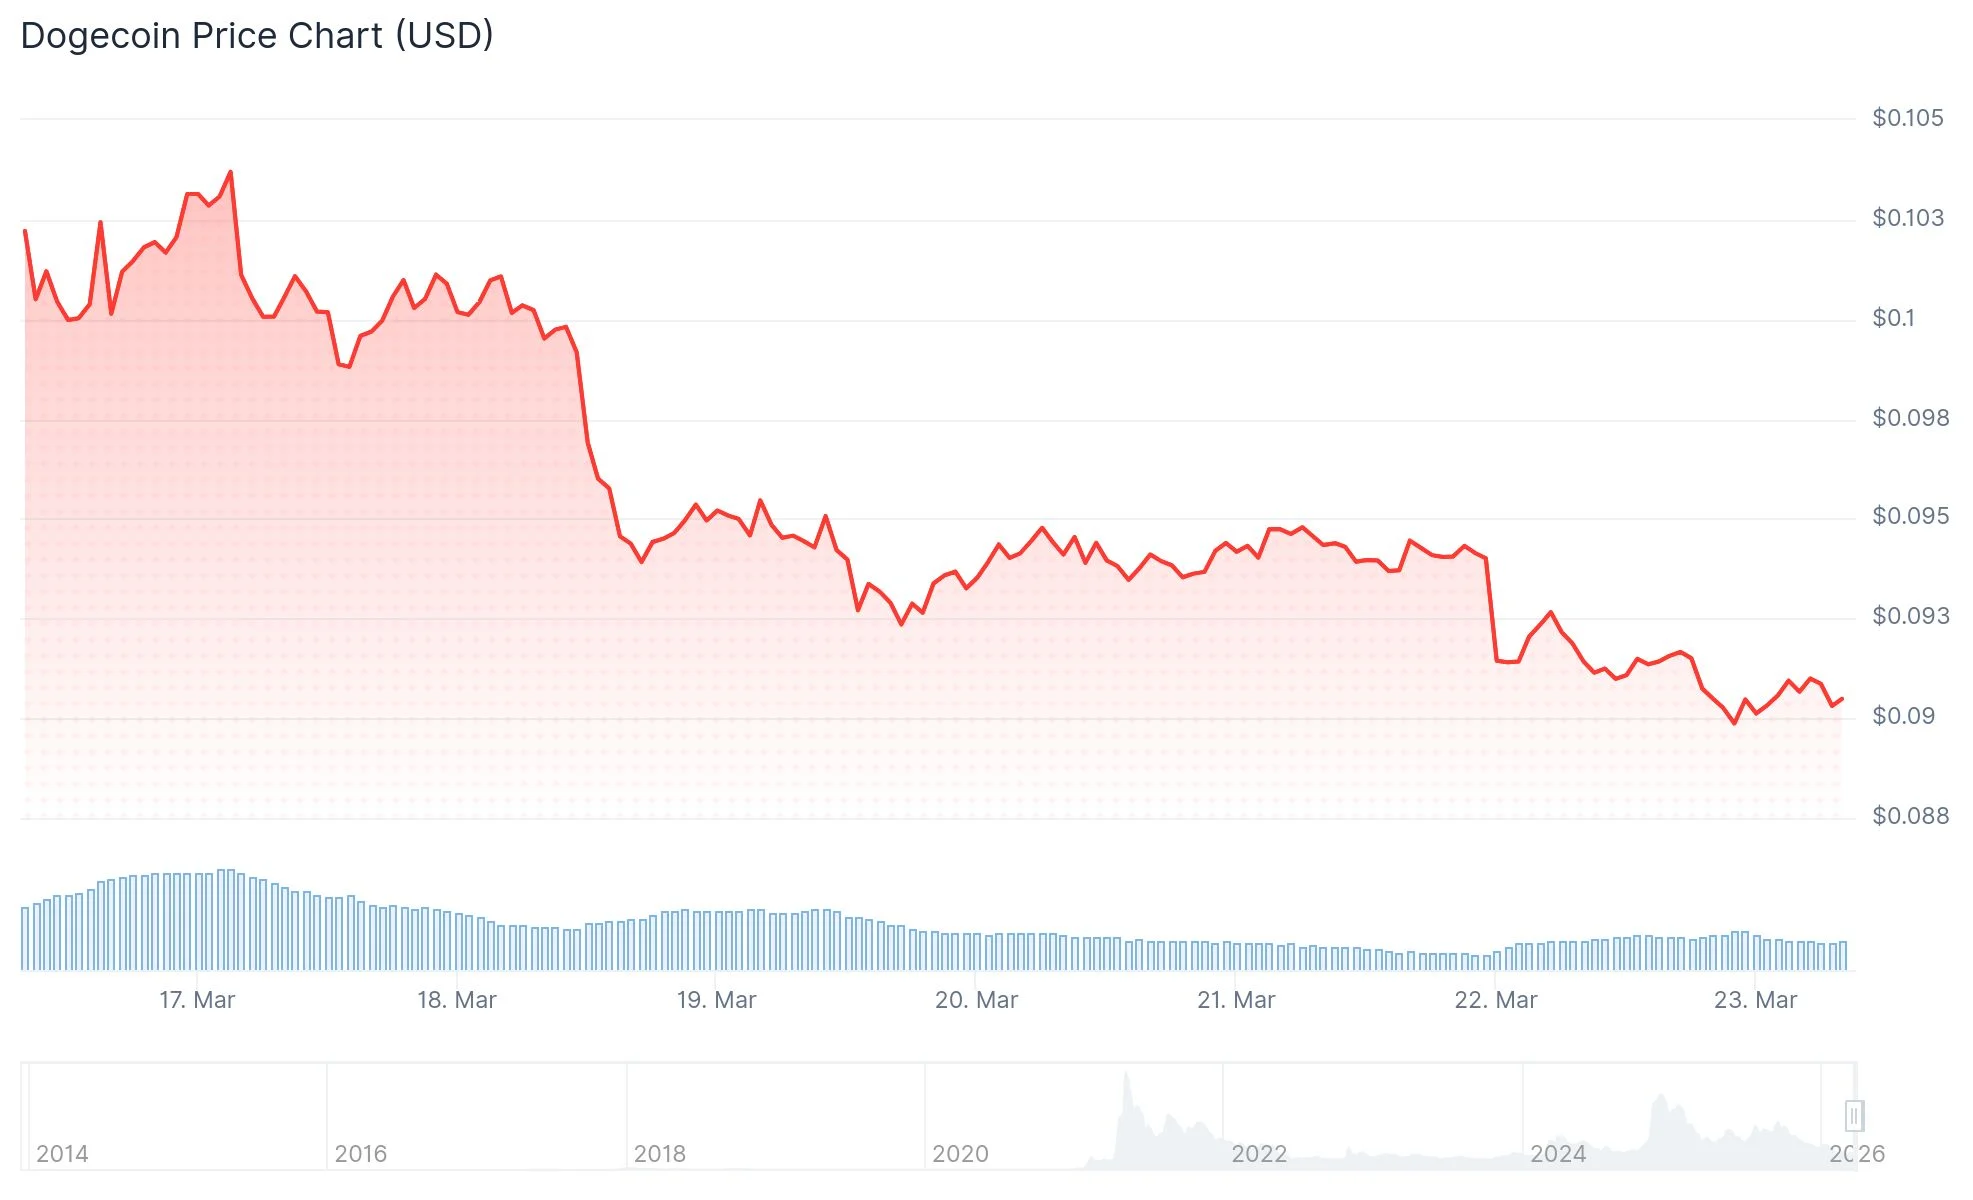
- DOGE currently trades around $0.094, trapped in a descending triangle pattern established since the 2021 all-time high
- Critical resistance zone positioned at $0.10; breakthrough could unlock price objectives between $0.20 and $0.30
- Elliott Wave framework indicates DOGE might be finishing its final correction phase around the $0.093–$0.094 area
- Technical expert Javon Marks spots a concealed bullish divergence pattern pointing toward a possible $0.44 destination
- Blockchain metrics reveal 60,000–110,000 active daily addresses, indicating consistent network engagement
Dogecoin (DOGE) maintains its position near the $0.094 mark as of March 21–22, 2026, confined within a prolonged technical consolidation formation that market participants are carefully monitoring.
Following its peak of $0.73 in May 2021, DOGE has experienced approximately 73% depreciation and transitioned into a lengthy consolidation period. Weekly chart analysis reveals a progression of declining peaks creating a descending triangle configuration, with foundational support maintained between $0.055 and $0.08.
Technical strategist CryptoPatel emphasized this formation, observing that DOGE is positioned near the top edge of an extended compression area. This pattern indicates contracting volatility as downward momentum diminishes.
[[LINK_START_0]]https://twitter.com/CryptoPatel/status/2035348200656159153?s=20[[LINK_END_0]]

Market analyst Crypto Lens draws attention to a 5-year accumulation zone situated near $0.07867. Historical breakouts from comparable formations generated advances of +173%, +180%, and +421%, although historical performance doesn’t ensure future replication.
Wave Analysis and Concealed Momentum Signals
Several technical experts interpret this pattern using Elliott Wave methodology. According to this perspective, DOGE appears to be finalizing the fifth and concluding wave of a corrective downtrend, with Fibonacci projection zones situated between $0.093 and $0.094.
Should this wave conclude around present price levels, purchasing interest could emerge to challenge resistance barriers at $0.098–$0.10.
[[LINK_START_1]]https://twitter.com/JavonTM1/status/2035370285659009386?s=20[[LINK_END_1]]
Independently, market analyst Javon Marks has detected a hidden bullish divergence developing within the $0.093–$0.095 territory. Price action establishes higher lows above $0.09, while momentum indicators register lower lows — a configuration frequently linked with diminishing downside pressure.
Marks proposes that if this divergence materializes fully, DOGE might experience a surge exceeding 350%, pursuing price objectives above $0.44 from approximately $0.093.
Critical Price Zones Under Observation
TradingView technical summaries continue displaying a “Sell” orientation across multiple moving average timeframes. Momentum oscillators such as RSI and Stochastic maintain predominantly neutral readings.
Market observers are monitoring these crucial levels:
- Resistance barriers: $0.095 and $0.098
- Major psychological threshold: $0.10
- Support foundations: $0.092 and $0.088–$0.090
A weekly candle closure above the descending trendline, accompanied by expanding volume activity, would represent the most definitive validation signal. Technical projection methodologies suggest that penetration above $0.10 could establish targets within the $0.20–$0.30 territory.
Blockchain analytics from Glassnode and IntoTheBlock document daily active addresses fluctuating between 60,000 and 110,000, with transaction volumes spanning from 80,000 to 200,000.
As of March 22, 2026, DOGE registered at $0.09191, reflecting a 2.81% decline across the preceding 24-hour period. The $0.09 support threshold continues to serve as the critical structural foundation under trader surveillance.