

Quick Overview
- XRP currently trades at $1.12, posting a 1.82% gain over the past 24 hours with market capitalization reaching $69.45 billion
- The cryptocurrency successfully breached a descending trend line at $1.10 and surpassed the 23.6% Fibonacci retracement threshold
- Critical resistance zones identified at $1.1720 and $1.2080 — momentum above $1.2080 targets $1.2450
- Failure to maintain momentum at $1.1740 could trigger pullback to support at $1.1250, $1.110, and $1.050
- Market analyst Ali Charts highlights $0.90 as a compelling accumulation zone for long-term positioning
XRP has successfully reclaimed territory above the psychologically important $1 threshold following recent downward pressure, currently changing hands at $1.12. The digital asset has registered a 24-hour increase of 1.82%, accompanied by $2.93 billion in trading volume and commanding a market capitalization of $69.45 billion.
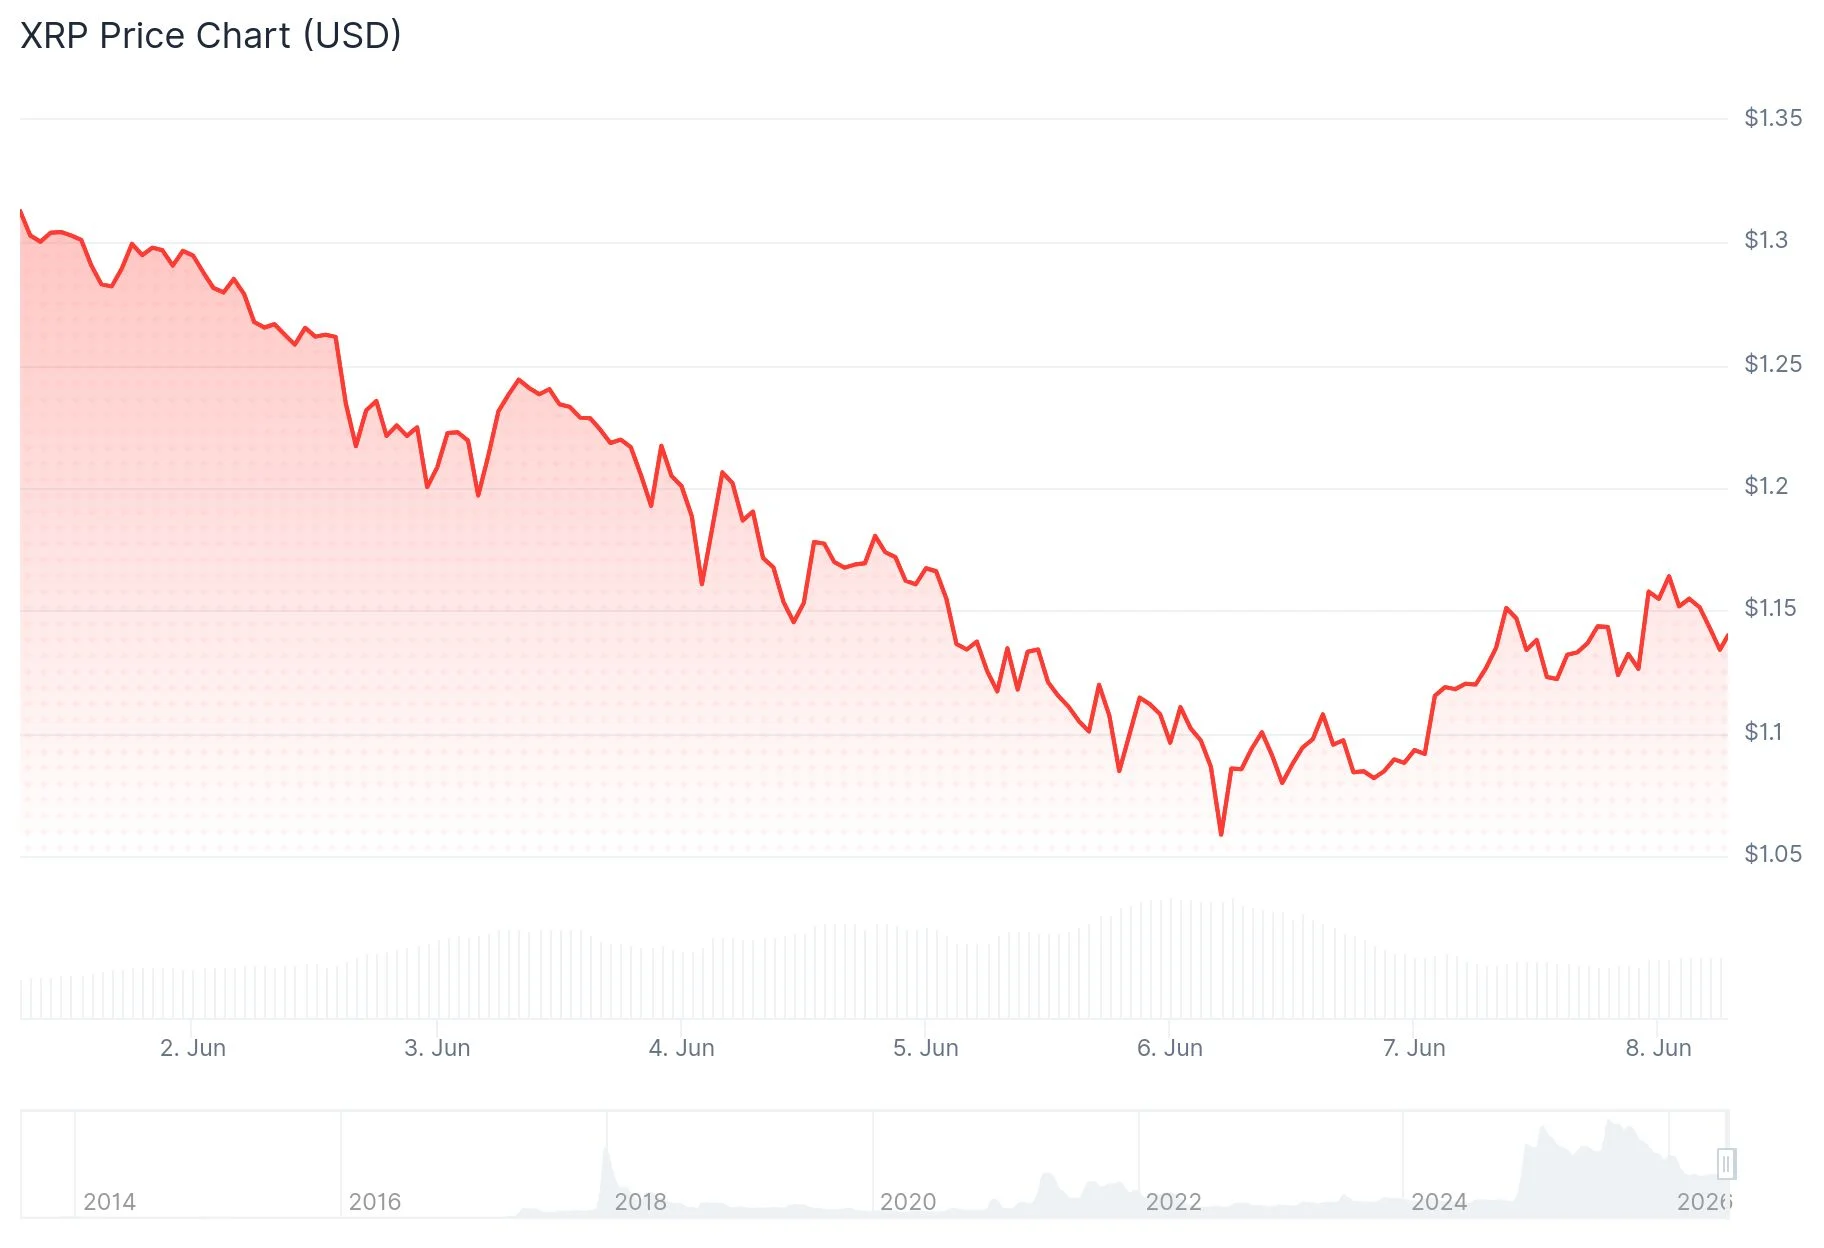
The upward momentum initiated after XRP successfully defended the $1.050 support zone. Market participants subsequently drove prices through the $1.10 barrier and eventually past $1.120, demolishing a descending trend line that had previously acted as formidable resistance on the 60-minute timeframe.
The cryptocurrency also penetrated the 23.6% Fibonacci retracement level calculated from the decline between the $1.3640 peak and the $1.052 trough. Current trading activity positions XRP comfortably above its 100-period Simple Moving Average on the hourly chart.
Market analyst Ali Charts shared insights via X (formerly Twitter), emphasizing close monitoring of the $0.90 price level. According to his assessment, should XRP retrace to that threshold, it would present an attractive entry point for investors with extended time horizons.

Critical Resistance Zones Under Scrutiny
The initial significant barrier emerges at $1.1720. Successfully clearing this obstacle would establish a pathway toward $1.2080, which aligns precisely with the 50% Fibonacci retracement marker. Beyond that threshold, subsequent objectives include $1.2150, $1.220, and ultimately $1.2450.
Potential Downside Scenario Analysis
Should XRP encounter resistance at $1.1740 without achieving an upward breakthrough, retracement becomes probable. Primary support materializes at $1.1250, with additional backing at $1.110. Weakness below $1.110 could accelerate declines toward $1.080, with the $1.050 region representing ultimate support.
The Relative Strength Index currently registers 25.40, maintaining position within oversold parameters, though the recent bounce hints at diminishing selling intensity. The MACD indicator remains positioned beneath its signal line at -0.0700 compared to -0.0476, suggesting persistent bearish momentum over the near term.
Crypto analyst Patel highlighted on June 7 that XRP presently trades approximately 37,000% above its 2017 floor levels. He disclosed his accumulation range spans $1.00 to $0.60, projecting that if XRP eventually reaches $10–$20 during subsequent market cycles, today’s price points may retrospectively appear as exceptional entry opportunities.
The MACD histogram value of -0.0224 confirms bears maintain control, requiring a positive MACD crossover before momentum conclusively pivots toward bullish territory.