
 Stock: Critical Support Collapses — Analysts Map Next Price Zones")
Key Takeaways
- XRP has crashed through a four-month consolidation pattern, currently hovering between $1.16 and $1.18 after a sharp 6% decline in one day.
- A critical support boundary between $1.26 and $1.28, which provided stability throughout March and April, has given way.
- All significant moving averages are positioned above current price levels, including the 200-day EMA beyond $1.60, reinforcing downside momentum.
- Should the $1.14–$1.18 zone collapse, technical analysts have identified potential landing zones near $0.92 and as deep as $0.63.
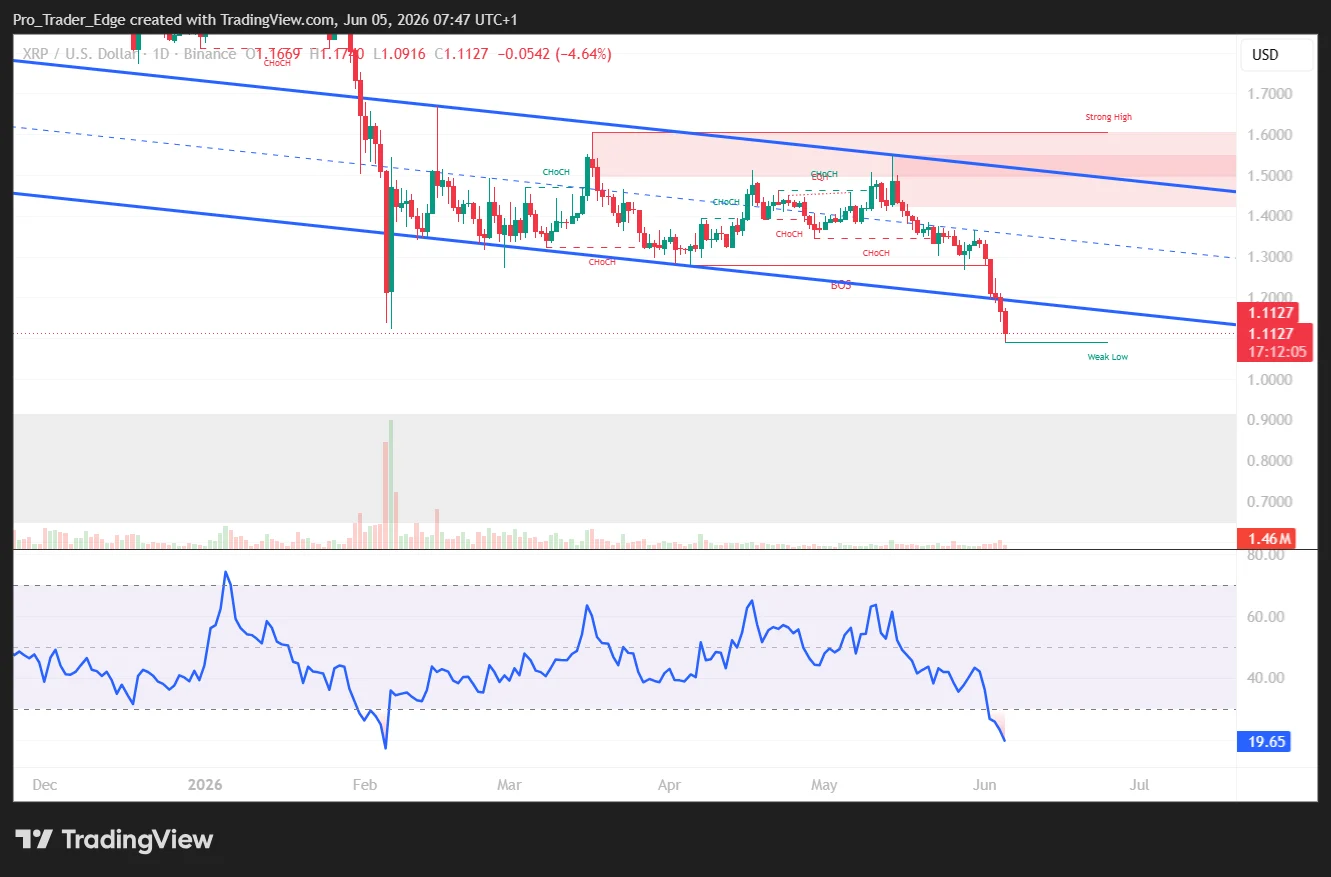
- The Relative Strength Index has plunged to approximately 24, entering oversold conditions, though broader technical indicators maintain bearish signals.
XRP has fallen through a trading corridor that contained price action for almost four months. Current pricing hovers around $1.16–$1.18, significantly beneath the range bottom that provided consistent support from March into April.
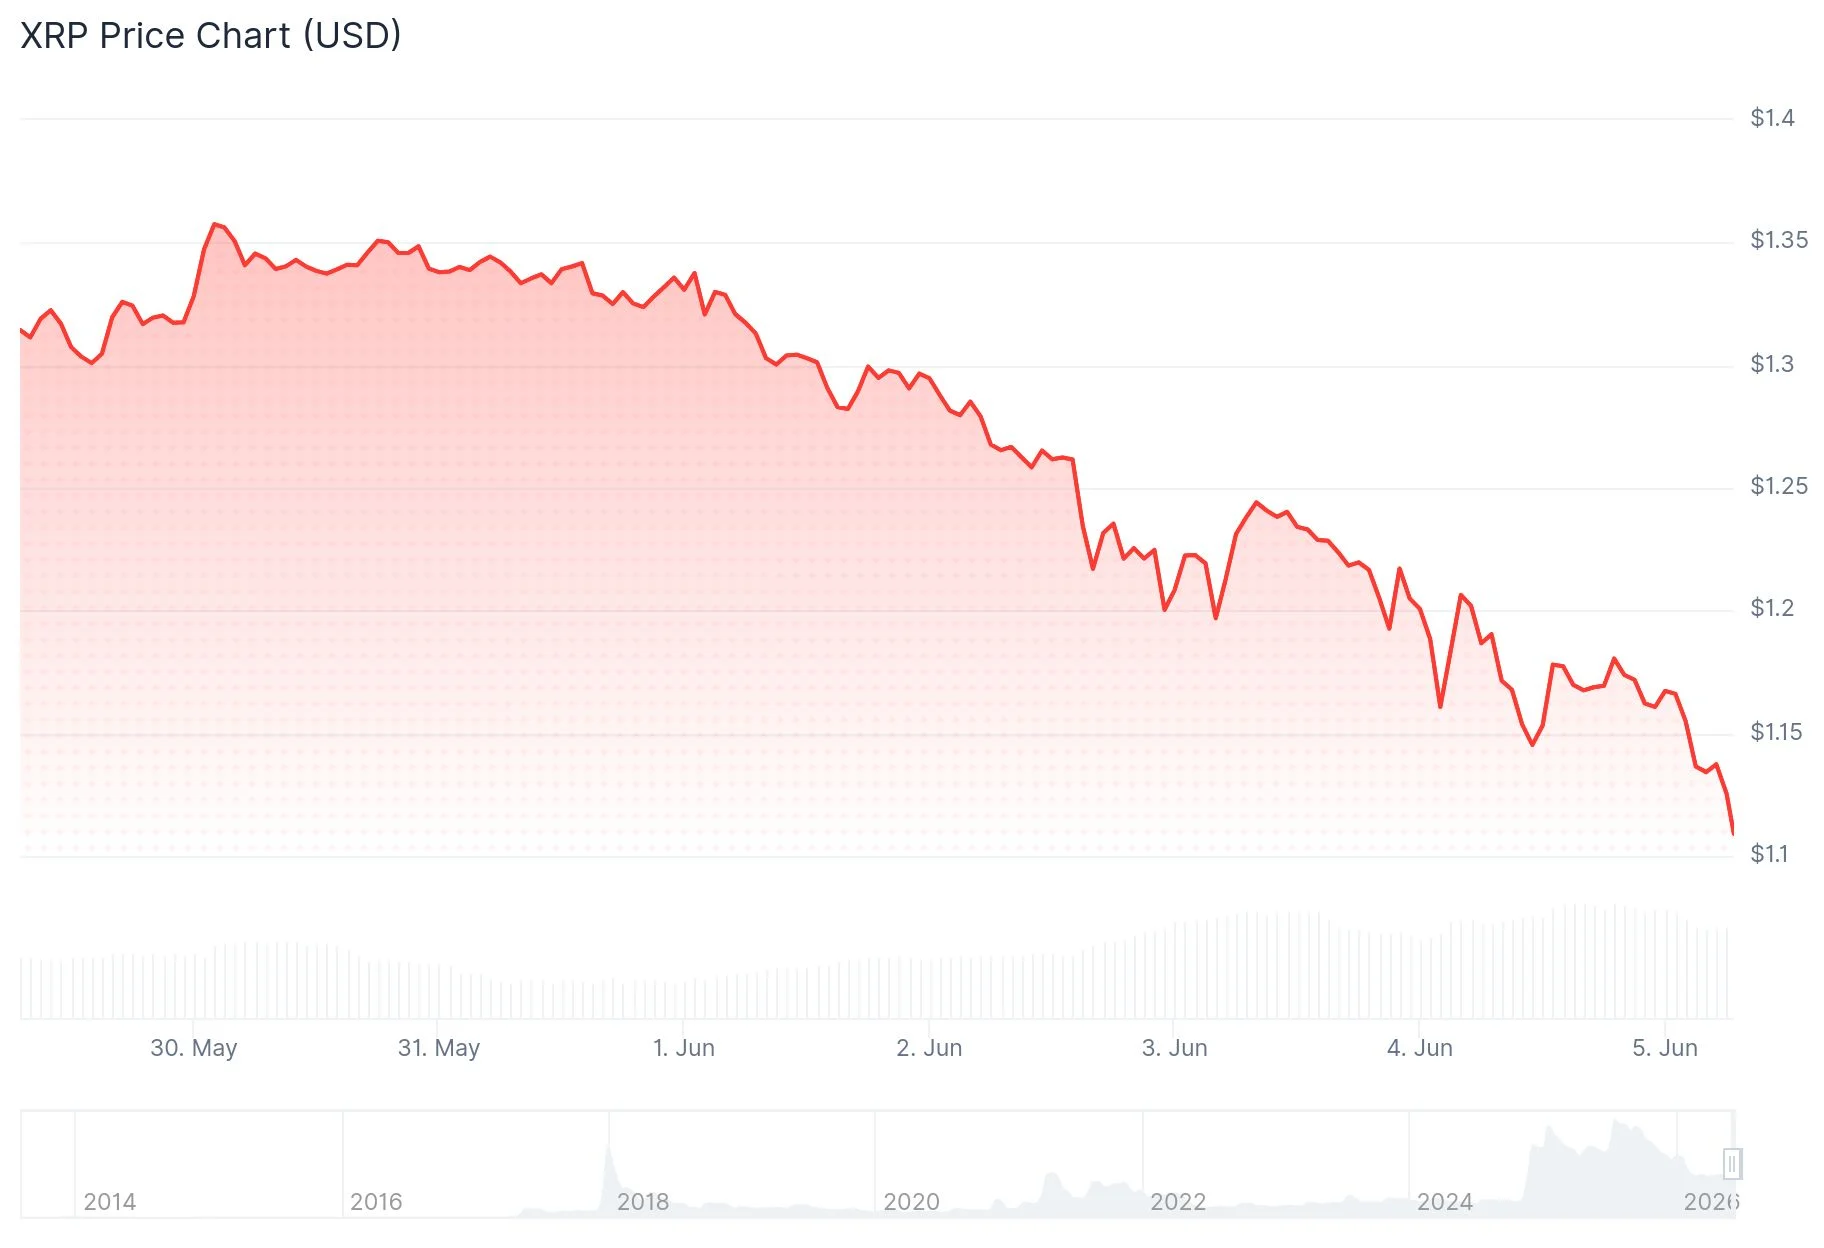
The established pattern featured an upper boundary near $1.55 and lower support spanning $1.26 to $1.28. That foundational level has now given way, with XRP declining approximately 6.1% across a 24-hour trading session.
Cryptocurrency analyst “Guy on the Earth” shared technical analysis on X displaying XRP positioned near $1.279 — directly at the range boundary — before the subsequent breakdown. His assessment pinpointed $1.10 as the initial downside objective following support failure, corresponding with the February wick low.
Market action appears to validate this projection. XRP has already penetrated below the range foundation, positioning the $1.10 target within striking distance.

Technical Indicators Paint Bearish Picture
The broader technical landscape suggests continued weakness. XRP currently trades beneath virtually every significant moving average. The 10-day EMA registers around $1.27, the 50-day EMA approaches $1.36, and the 200-day EMA exceeds $1.60. Technical strategists suggest XRP would need to recapture the $1.30 threshold with substantial volume to alter sentiment trajectory.
The comprehensive TradingView technical assessment tilts neutral-to-bearish, with moving average indicators producing the most pronounced sell signals.
Analysts Identify Lower Price Targets
Analyst Crypto Patel, sharing analysis via X, characterized the $1.10–$1.30 territory as an active accumulation corridor. He indicated that a breach of this zone could expose the $0.65–$0.85 range as a significant accumulation opportunity.
Analyst “Guy on the Earth” positioned the most probable bottom formation between $0.75 and $0.95 during extended weakness, with an extreme scenario level approaching $0.63 — a threshold that would eliminate the majority of XRP’s appreciation since late 2023.
Additional technical work from trader Blacksea highlighted on X that XRP appears to be forming an identical falling wedge configuration that preceded significant price movement in 2024. Blacksea observed this pattern historically precedes strong reversals, though current price behavior has not yet validated any breakout scenario.
A Fibonacci retracement calculation near $0.92 corresponds with a frequently monitored support corridor between $0.87 and $0.92. Pivot point methodology additionally identifies $1.097 as an immediate downside level with $0.811 representing deeper structural support.
The 14-period RSI has declined to approximately 24.26, beneath the conventional oversold marker at 30. The Commodity Channel Index registers near -232. Daily volume continues above $3 billion, demonstrating sustained market participation in XRP.
At publication time, XRP was exchanging hands at approximately $1.17.