
 Stock Price Alert: Crypto Analyst Predicts Potential Decline to $0.84")
Key Takeaways
- XRP has declined beneath the $1.20 threshold, reaching an intraday bottom at $1.1401.
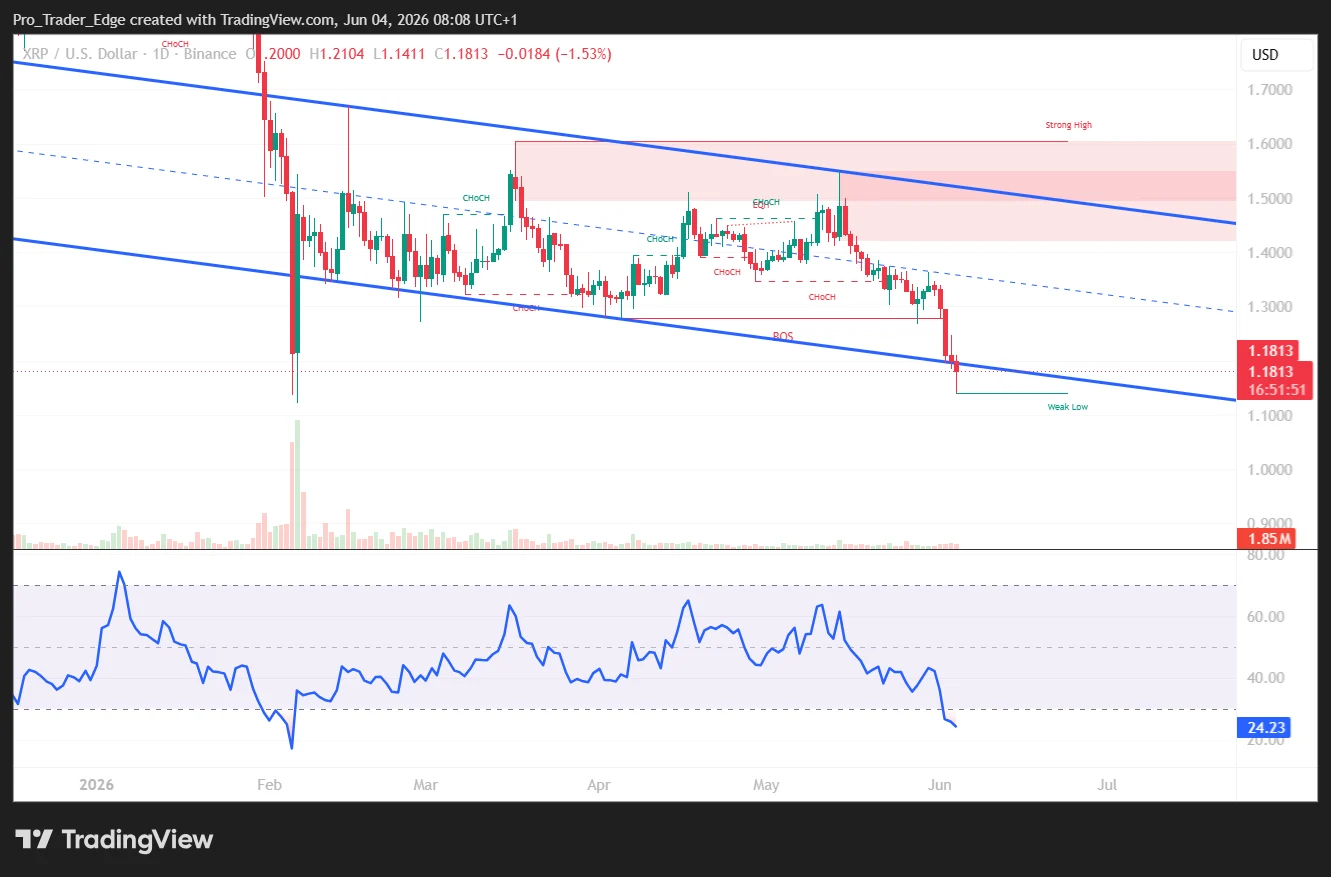
- Trading activity remains below the 100-hour Simple Moving Average, signaling continued downward momentum.
- Relative Strength Index readings indicate oversold territory, suggesting potential for a near-term rebound.
- Recovery efforts require a sustained breakout above $1.1950, with $1.32 representing the critical bullish pivot.
- Technical analyst ChartNerd identifies $0.84 Middle Regression Band as potential downside target based on historical patterns.
XRP has experienced persistent downward pressure throughout recent trading sessions, declining in tandem with broader cryptocurrency market weakness affecting Bitcoin and Ethereum.
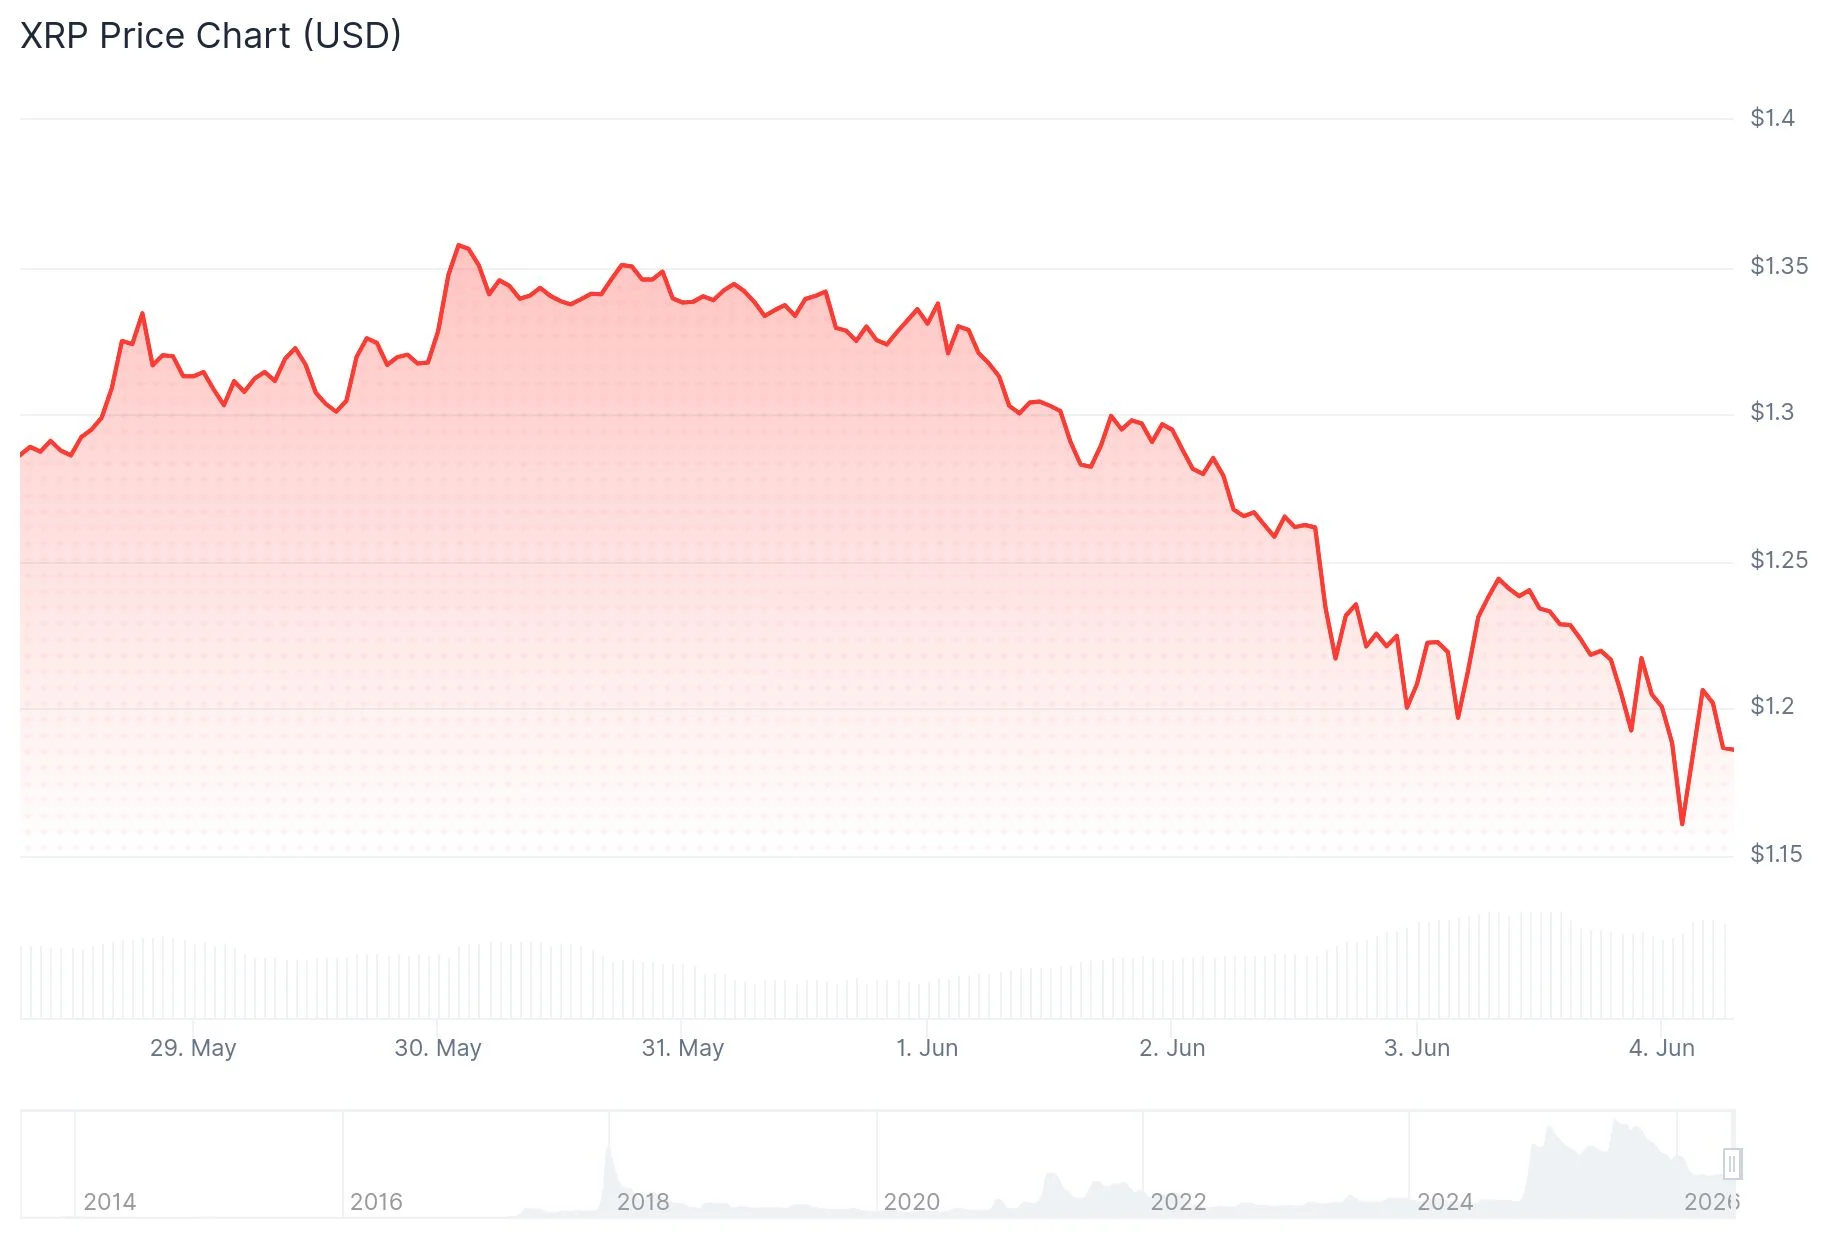
The digital asset breached the psychologically significant $1.20 mark and continued its descent to an intraday minimum of $1.1401. Currently, the token is trading within a consolidation zone between $1.15 and $1.20, positioned beneath its 100-hour Simple Moving Average.
As of this writing, XRP is changing hands near $1.22, reflecting approximately 1% appreciation over the last 24-hour period.
Technical chart analysis reveals a descending trendline on the hourly timeframe, establishing resistance at the $1.1950 level. Additionally, the price has been unable to recapture the 23.6% Fibonacci retracement of the downward movement from the $1.3640 peak to the $1.1401 trough.

For any meaningful recovery attempt, XRP must first break through and establish a closing price above $1.1950. Such a breakthrough could pave the way toward $1.20, followed by $1.22, and potentially reaching $1.25.
Critical $1.32 Level Holds Key to Trend Reversal
The pivotal resistance zone for bullish traders lies at $1.32. A decisive close above this threshold could trigger a rally toward $1.43, representing approximately 17% upside potential from present trading levels.
Nevertheless, the MACD momentum indicator continues displaying negative histogram readings, reinforcing the prevailing bearish market structure. Until clear technical confirmation emerges, both upward and downward scenarios remain viable possibilities.
XRP functions predominantly as a bridge currency for international remittances, and community members have been actively discussing what they term an “XRP Supercycle” — a theory suggesting explosive price appreciation ahead. However, current price behavior has yet to validate this optimistic outlook.
Cryptocurrency technical analyst ChartNerd (@ChartNerdTA) issued a cautionary alert via X platform, highlighting that XRP has fallen below the Upper Regression Band at $1.35 within the Gaussian Channel framework. He emphasized that historical precedent shows every previous breakdown below this band has resulted in retracement to the Middle Regression Band, presently positioned at $0.84. According to his analysis, the anticipated 2026 “homecoming” to this level remains a credible scenario.
Critical Support Zones Under Scrutiny
Regarding downside risk, the first support level emerges around $1.16, with secondary support at $1.155. Should XRP fail to maintain $1.155, attention shifts to $1.15 and subsequently $1.144.
A breakdown beneath $1.144 would expose deeper support at $1.14 and potentially accelerate further losses.
The Relative Strength Index currently resides in oversold territory, a condition that often attracts opportunistic buyers seeking short-term bounces. However, oversold readings alone do not guarantee trend reversals without accompanying catalysts or volume confirmation.
XRP most recently tested $1.1401 during this correction phase, establishing the current swing low reference point for technical analysis.