
 Stock Faces Major Resistance at 200-Day Moving Average — Here’s What Could Come Next")
Key Takeaways
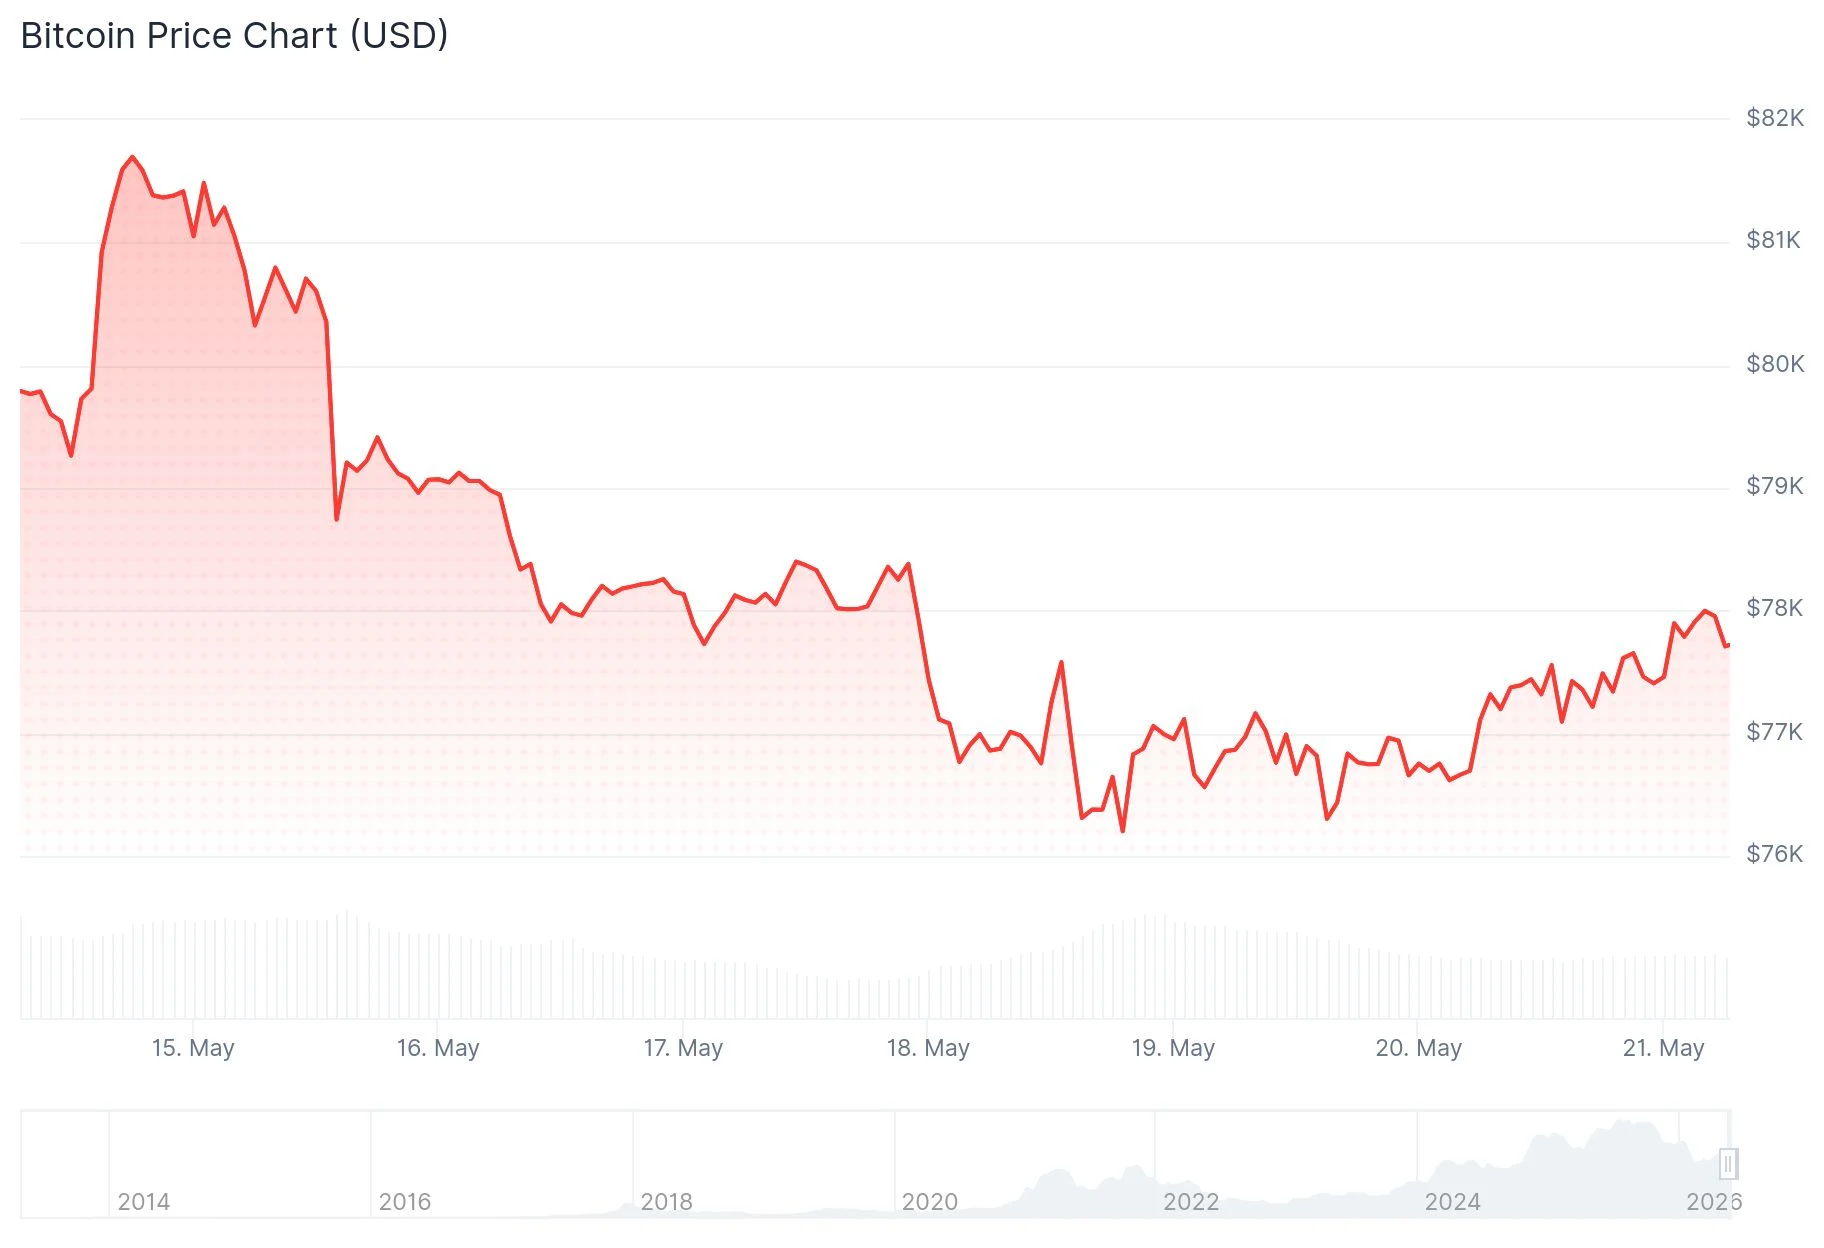
- BTC encountered significant resistance at its 200-day moving average around $82,400, retreating to approximately $77,900.
- The Bull Score Index from CryptoQuant has fallen to 20, indicating what the analytics firm considers “extremely bearish” conditions.
- Over the last two weeks, U.S. spot Bitcoin ETFs experienced approximately $2 billion in capital outflows.
- Buying pressure from major markets including the United States, South Korea, and Hong Kong remains subdued.
- Should the decline persist, analysts identify $70,000 as the critical on-chain support level to monitor.
The recent Bitcoin surge from February’s bottom has encountered significant obstacles. Following an advance toward $82,000, the cryptocurrency met firm resistance at the 200-day simple moving average (SMA) and has subsequently retreated to approximately $77,900.
Market participants pay considerable attention to the 200-day SMA. This technical indicator is frequently regarded as the critical threshold distinguishing a sustainable recovery from a temporary bear-market rebound. The inability to breach this level has sparked concerns about the underlying strength of the recent advance.
Technical analyst Ali Charts is monitoring the $77,800 threshold with particular interest on shorter timeframes. Ali Charts notes that Bitcoin has established a channel pattern on the 15-minute chart, with $77,800 serving as the upper boundary. A decisive break above this level could potentially trigger a move toward $79,000. Should this resistance prove insurmountable, the analyst anticipates a decline toward $76,900 or potentially the $76,000 zone.
Declining Demand Emerges as Primary Concern
CryptoQuant, a leading analytics platform, identifies deteriorating demand as the fundamental factor behind the stalled rally. The upward momentum during April and early May was supported by three primary drivers: leveraged futures activity, spot market buying, and capital inflows into U.S. ETFs. Each of these catalysts has since diminished.

The Bull Score Index tracked by CryptoQuant has declined from 40 to 20. The analytics firm characterizes this measurement as “extremely bearish,” comparable to readings observed during the February-March timeframe when Bitcoin oscillated between $60,000 and $66,000.
The Coinbase premium indicator — which gauges whether BTC commands higher prices on Coinbase relative to international exchanges — has remained in negative territory throughout much of both the rally and the ensuing correction. Negative readings indicate that American-based purchasers are not aggressively pushing prices upward.
ETF Capital Flight and Subdued Asian Interest
U.S. spot Bitcoin ETFs have transitioned into net redemption mode. Data from SoSoValue reveals that these investment vehicles shed approximately $979.7 million during the week concluding May 19, following nearly $1 billion in outflows the previous week. This represents a sharp reversal from six consecutive weeks of inflows that had supported the earlier price appreciation.
ETF flow metrics for May 20 indicated Bitcoin ETFs recorded $70.5 million in net withdrawals while Ethereum ETFs experienced $28.1 million in outflows, signaling that investor appetite has yet to fully rebound.
South Korea’s kimchi premium, which measures BTC demand on Korean trading platforms, has turned negative. Hong Kong’s trio of spot Bitcoin ETFs have registered negligible trading volume throughout May, seldom exceeding a few million dollars collectively on any given day.
Should downward pressure continue, CryptoQuant identifies $70,000 as the next significant on-chain support zone. This price level previously capped rally attempts in both October and January and currently aligns with the traders’ realized price according to on-chain metrics.
Bitcoin is currently trading above $77,200 and the 100-hour simple moving average, with immediate resistance positioned at $78,300 followed by $79,000.