
 Stock Price: Month-Long Consolidation Nears Critical Breakout Point")
Key Takeaways
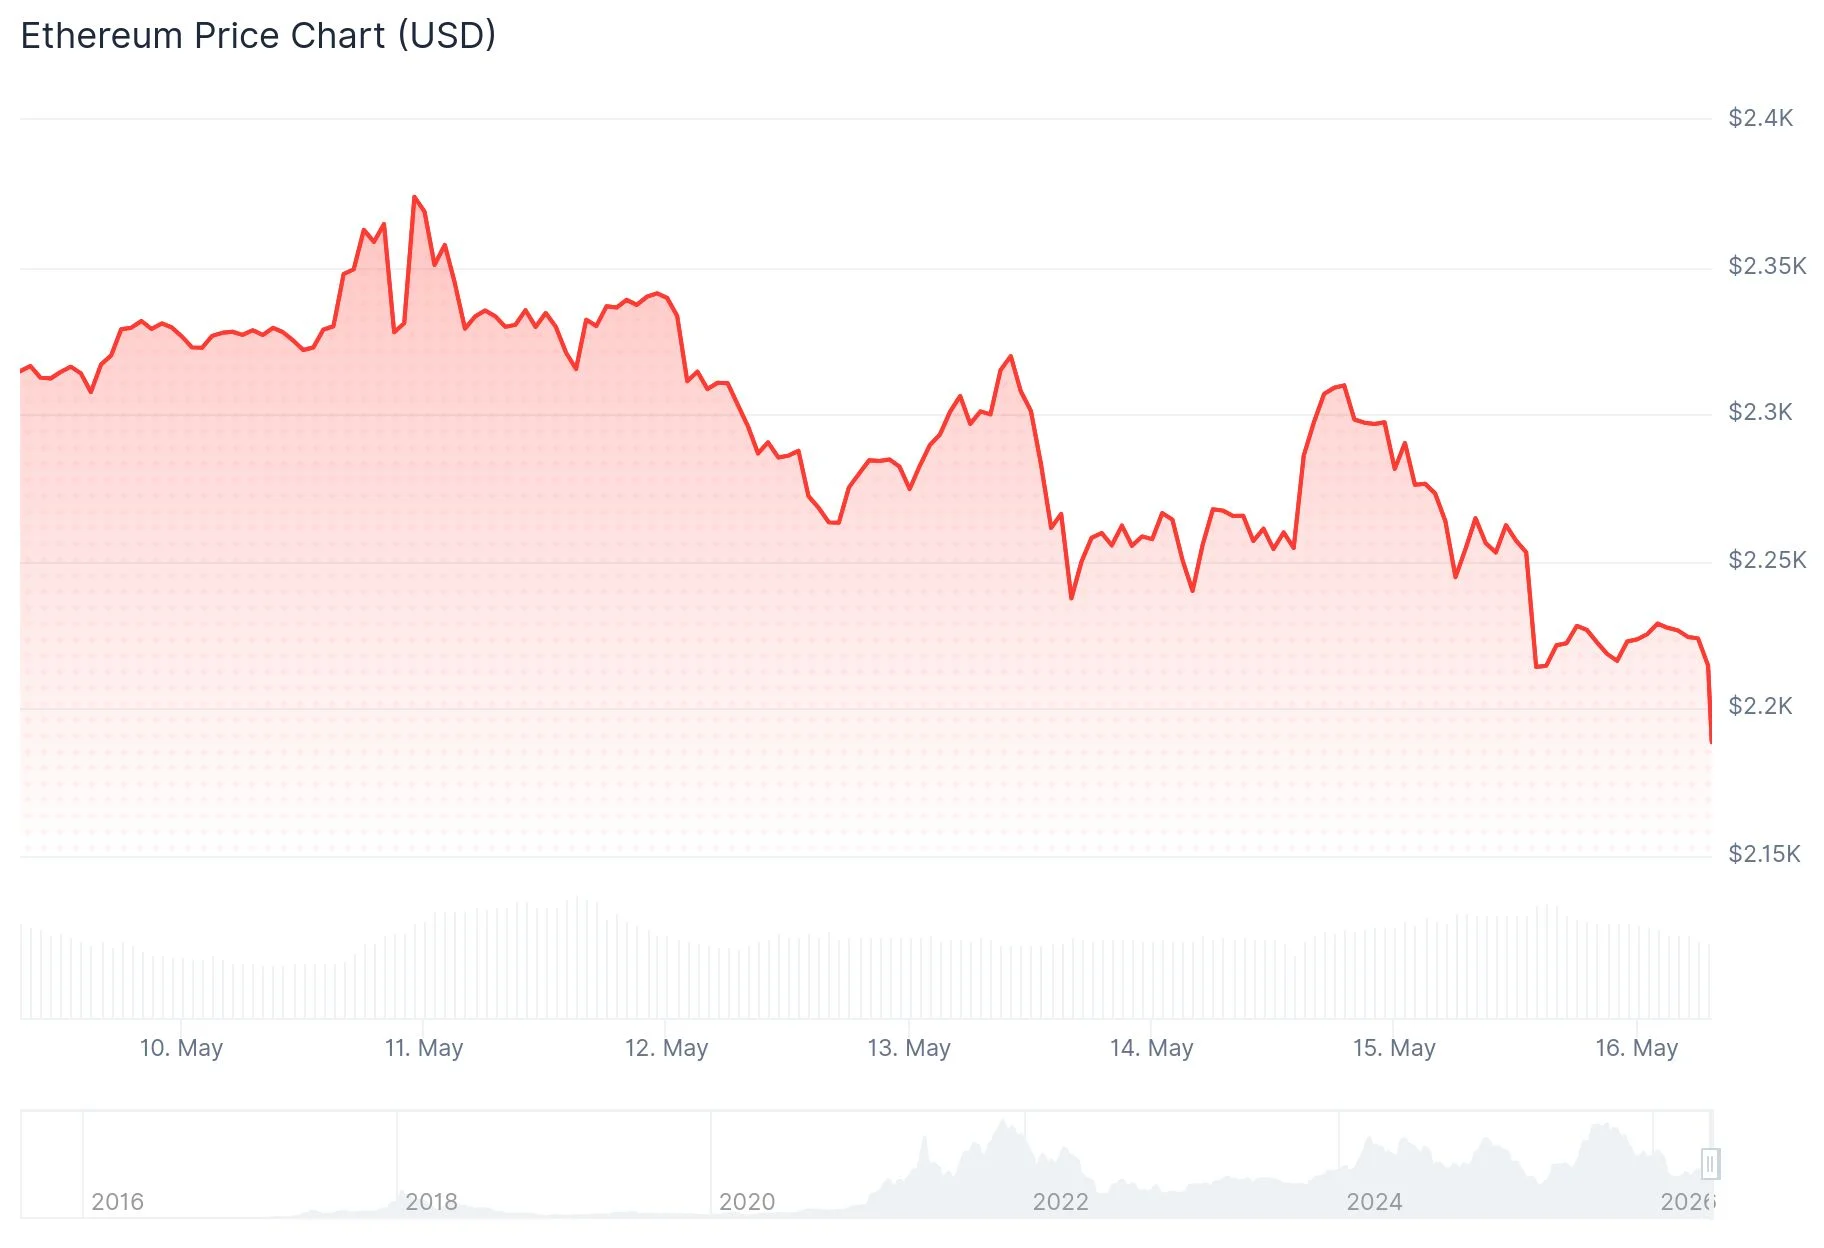
- Ethereum’s current price sits between $2,226 and $2,263, reflecting a decline of approximately 3.74–5.5% in recent trading sessions.
- Technical indicators show weakness as the RSI slides beneath the 50 threshold while MACD turns negative, signaling deteriorating momentum.
- According to Ali Charts, the $1,071 level represents a compelling accumulation opportunity at the channel’s lower boundary.
- For nearly 30 days, ETH has remained confined within a $2,250–$2,380 trading corridor; a decisive breach in either direction may catalyze a movement exceeding 10%.
- Crypto Patel’s long-range outlook identifies potential peaks at $5,000, $10,000, and $15,000, with a recommended buying zone spanning $1,500–$2,000.
Ethereum has encountered bearish momentum as selling forces dominate the near-term landscape. The digital asset has retreated approximately 3.74% during the previous 24-hour period and currently trades within the $2,226–$2,263 corridor, based on CoinMarketCap data.
Market analyst Trader Symba observed that ETH has begun responding to its established trading parameters and proposed that continued resilience in traditional equity markets—specifically the S&P 500—could provide upward catalysts for both Bitcoin and Ethereum. His technical analysis illustrated ETH piercing through a near-term downward trendline following successful defense of support positioned near the range’s lower threshold.
Crypto analyst Ace pinpointed significant buying activity emerging after a liquidity sweep through the $2,241.73 low. Subsequently, price action advanced into the $2,306.87 liquidity cluster, where substantial demand absorption occurred prior to Ethereum’s upward continuation. Current support levels are established around the $2,240–$2,250 zone.
Blockchain analytics platform Santiment provided additional context through on-chain metrics. Despite the recent 5.5% price decline across three days, Ethereum’s network registered its most substantial realized profits in three weeks, totaling approximately $74.58 million. Santiment’s analysis suggested this selling activity originated from long-term holders with minimal cost basis rather than emotional market participants.

Technical Indicators Flash Warning Signals
The Relative Strength Index has descended to 43.22, crossing below the critical 50 midpoint. Meanwhile, the MACD indicator displays a reading of -13.71, positioned beneath its signal line at 0.52, with the histogram transitioning to bearish territory. These combined metrics suggest diminishing buyer enthusiasm and a potential retest of the 100-day moving average positioned near $2,145.
Crypto Patel examined the Ethereum rainbow chart framework, asserting that ETH currently occupies what he characterizes as a “cheap zone”—a valuation level that has materialized only sparingly throughout history before price action advanced toward the “take profit” territory. His strategic accumulation window spans $1,500–$2,000, complemented by extended price objectives of $5,000, $10,000, and $15,000.
Meanwhile, Ali Charts presented a more conservative short-term perspective, publishing analysis on X suggesting that $1,071—located at the channel’s base—constitutes an attractive entry point for ETH accumulation.
Critical Range Determines Future Direction
Daan Crypto Trades articulated the present market structure with precision. Ethereum has remained imprisoned within the $2,250–$2,380 boundaries for approximately four weeks, characterized by persistent buyer defense at the lower threshold and consistent seller resistance at the upper limit.
A definitive breakout above the $2,380–$2,400 resistance zone would transfer control to bullish participants, potentially unleashing momentum toward $2,500 and eventually the $2,640 CME gap territory. Conversely, a breakdown beneath $2,250 would empower sellers and likely trigger extended consolidation at lower price levels.
Current 24-hour trading volume registers at $33.17 billion, while Ethereum’s market capitalization stands at $268.45 billion.