

TLDR
- XRP currently hovers near $1.39, marking a 15.6% decline throughout February 2026, positioned beneath both 50-day and 200-day EMAs.
- Three technical indicators that preceded the November 2024 surge — exchange deposit spikes, contracting USD liquidity, and tightening XRP liquidity — are materializing once more.
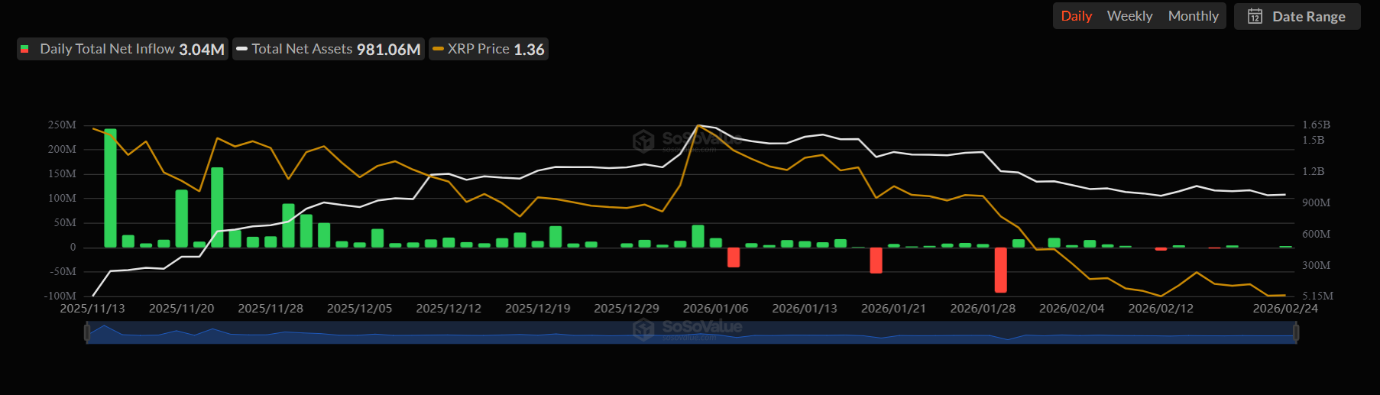
- Spot XRP ETFs attracted $3.04M in new capital on February 24, elevating cumulative net inflows to $1.23B since their debut.
- Probability of a June Federal Reserve rate reduction declined to 49.6%, dampening cryptocurrency market sentiment following robust consumer confidence readings.
- Market observers project price objectives ranging from $2.00 for medium-term scenarios to $10 if 2024 breakout dynamics repeat.
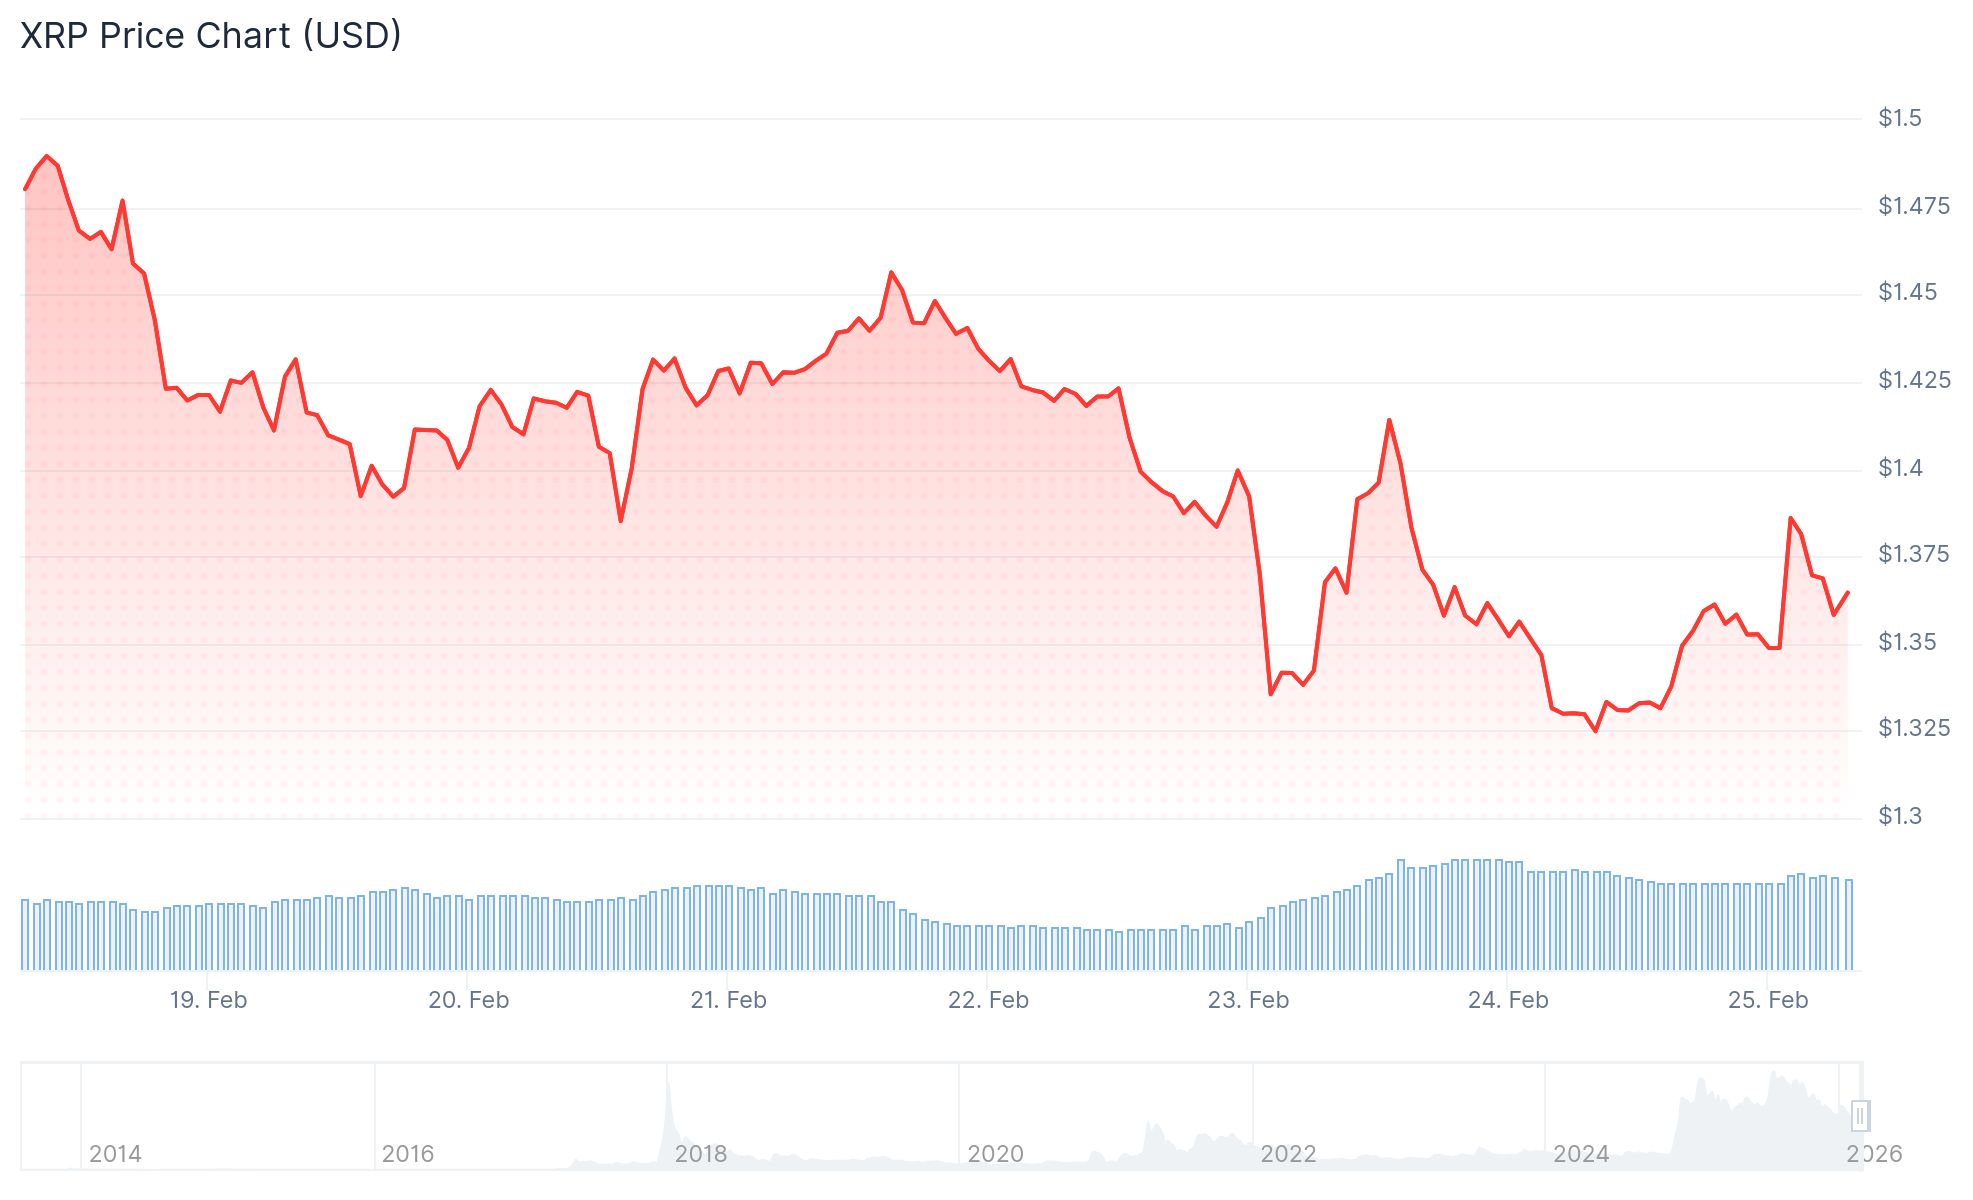
XRP maintains a trading position near $1.39 in late February 2026, reflecting a 15.6% monthly decline. The digital asset has fallen below both its 50-day and 200-day exponential moving averages, suggesting bearish momentum in the near term.
Despite current downward pressure, market observers are monitoring three distinct indicators that emerged immediately before XRP’s dramatic surge during late 2024.
In November 2024, XRP rocketed from $0.50 to reach $3.40 by January 2025 following Donald Trump’s victory in the U.S. presidential election. This movement represented one of the most dramatic price increases in the asset’s trading history.
Crypto analyst Xaif, referencing CryptoQuant analytics, notes these identical three indicators are developing again throughout February 2026.

The initial indicator involves increased exchange deposits on Binance. Prior to the 2024 surge, substantial XRP movements to the exchange escalated — notably 15.12 billion XRP on October 20, 2024, followed by 10.345 billion XRP on November 23, 2024. These deposit waves didn’t trigger price declines. Rather, volatility expanded and prices rose. Comparable deposit patterns are emerging currently.
Liquidity Is Tightening Again
The second indicator involves contracting USD liquidity within XRP’s AMM pools. Before the 2024 breakout, daily USD liquidity declined to approximately $1.5 million. Throughout February 2026, this metric ranges between $1.9 million and $2.1 million — a comparable compression following a September 2025 peak exceeding $6 million.
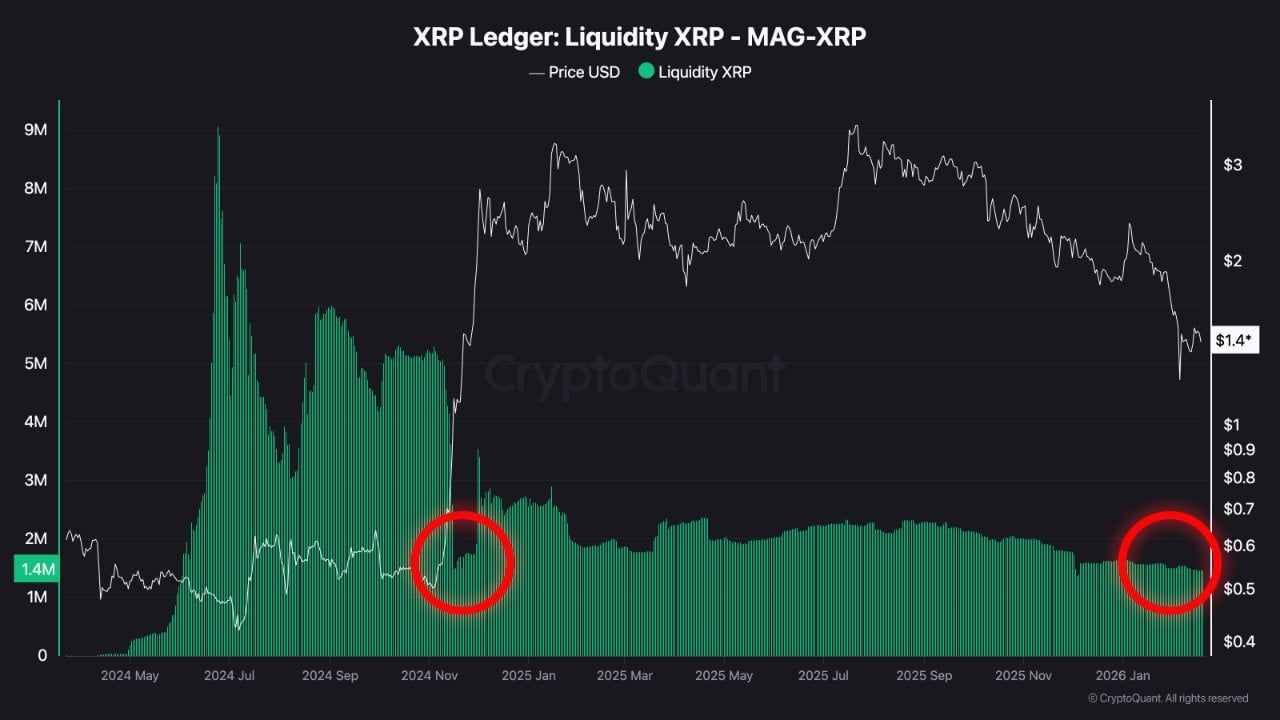
The third indicator tracks declining XRP liquidity. During November 2024, available XRP in AMM pools contracted to 1.5 million before the rally commenced. Currently, daily XRP liquidity averages 1.385 million — registering even lower than pre-rally levels.
Xaif suggests these three indicators, converging simultaneously again, could establish conditions for a movement toward $10, representing a 619% appreciation from present valuations. He advises traders to verify with derivatives metrics and funding rates before making decisions.
ETF Inflows and Macro Headwinds
From an institutional perspective, XRP-spot ETFs recorded $3.04 million in net capital inflows on February 24, elevating total cumulative inflows to $1.23 billion since the products launched in November. These ETFs have experienced merely five days with net outflows during this period.
US consumer confidence registered at 91 in February, surpassing the anticipated 87, which diminished expectations for a June Federal Reserve rate reduction. The CME FedWatch Tool displayed those probabilities declining from 54.3% to 49.6% on February 24.
XRP settled at $1.3489 on February 24 before advancing 3.66% to $1.3983 during morning trading on February 25. Critical resistance levels exist at $1.50, $2.00, and $2.50, while support zones remain at $1.00 and $0.7773.