

Quick Overview
- XRP rallied from $1.33 to $1.35 with heightened trading activity but couldn’t breach the $1.36 barrier
- Exchange-traded fund products recorded $3.32 million in capital inflows—insufficient to trigger significant upward price movement
- Critical overhead resistance zones are positioned at $1.36–$1.40; bulls need a decisive breakout for momentum continuation
- Downside support levels include $1.34 as immediate defense, followed by $1.31–$1.32
- A delicate US-Iran peace agreement boosted risk-on sentiment across markets, stabilizing cryptocurrency valuations
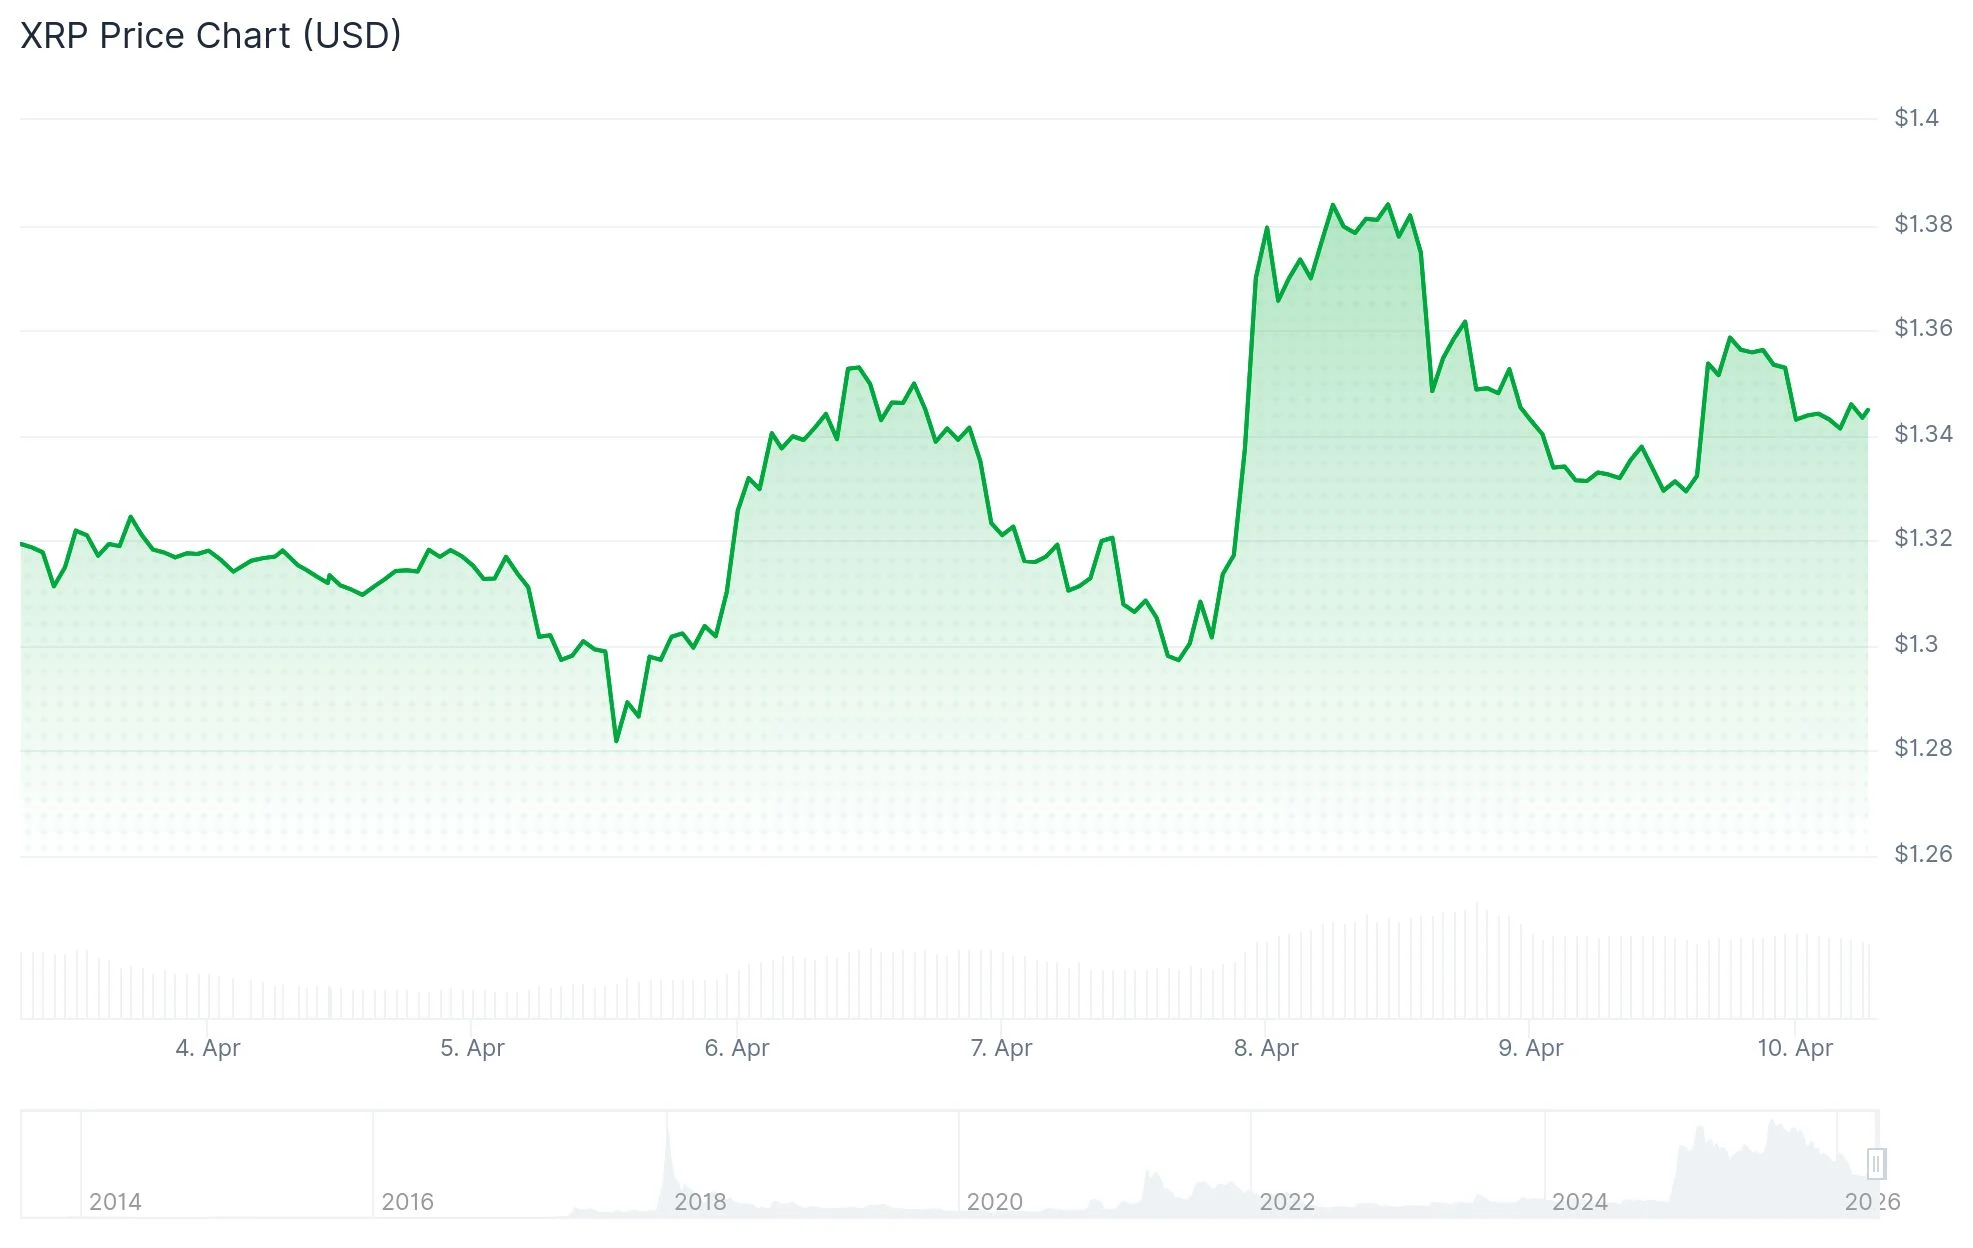
XRP currently hovers near $1.35 following a notable bounce from its recent bottom around $1.32. The upward movement occurred alongside substantial trading volume, allowing the digital asset to reclaim ground above the $1.34 threshold. Yet, bullish momentum stalled as price action consolidated in a narrow band beneath $1.36, lacking the conviction needed for sustained gains.
This price behavior reflects the wider cryptocurrency market’s stabilization, with Bitcoin advancing 0.8% to reach $72,271 and overall digital asset market capitalization climbing 1.4% to $2.52 trillion. Meanwhile, the crypto fear and greed index sits at 14, remaining entrenched in “Extreme Fear” territory.
During this recovery window, XRP-focused ETF products attracted $3.32 million in fresh capital. For an asset with XRP’s market capitalization, this inflow figure lacks the magnitude to spark substantial price action. Market observers suggest the rebound stems primarily from technical factors rather than concrete fundamental developments.
Critical Support and Resistance Zones
Examining the hourly timeframe reveals XRP positioned above its 100-hour Simple Moving Average, having successfully cleared the 38.2% Fibonacci retracement level calculated from the decline between $1.3963 and $1.3222. A descending trendline creates resistance near $1.3550.

The primary overhead barrier stands at $1.36. Breaking cleanly above this level would expose $1.368, which corresponds with the 61.8% Fibonacci retracement marker. Additional resistance targets emerge at $1.38 and $1.40.
For bearish scenarios, $1.34 serves as the critical near-term support floor. Losing the $1.31–$1.32 zone would suggest the recent bounce has exhausted itself. Further deterioration could bring $1.28 and $1.265 into focus.
Global Developments Influencing Market Sentiment
A tentative ceasefire agreement between the United States and Iran, facilitated through Pakistani diplomatic channels on April 7, contributed to improved sentiment across risk-sensitive asset classes. The arrangement mandated Iran’s reopening of the Strait of Hormuz, a critical maritime passage handling approximately 20% of worldwide petroleum shipments. Commercial oil tanker movement through the waterway remains partially restricted.
On April 9, President Trump announced continued American military presence in the region pending Iran’s complete adherence to ceasefire terms. Equity markets extended gains for a second straight session, with both the Nasdaq and Dow Jones Industrial Average posting 0.73% increases. Cryptocurrency markets steadied in tandem with traditional equities as investor risk tolerance showed marginal improvement.
Current market data shows XRP maintaining the $1.35 level, though the $1.36 resistance barrier remains unbroken.